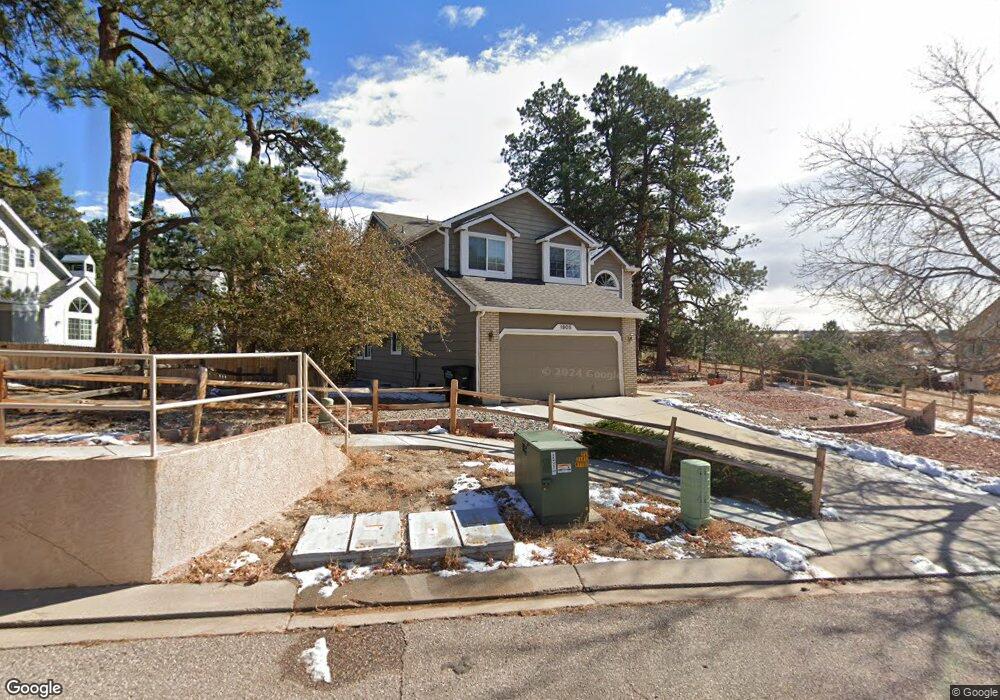
1905 Springcrest Rd Colorado Springs, CO 80920
Pine Creek NeighborhoodEstimated Value: $600,000 - $659,000
5
Beds
4
Baths
2,495
Sq Ft
$254/Sq Ft
Est. Value
About This Home
This home is located at 1905 Springcrest Rd, Colorado Springs, CO 80920 and is currently estimated at $632,844, approximately $253 per square foot. 1905 Springcrest Rd is a home located in El Paso County with nearby schools including Mountain View Elementary School, Challenger Middle School, and Pine Creek High School.
Ownership History
Date
Name
Owned For
Owner Type
Purchase Details
Closed on
May 1, 2003
Sold by
Chang Chuan Ying
Bought by
Li Chung Cheng
Current Estimated Value
Purchase Details
Closed on
Jun 8, 2000
Sold by
Taylor Daniel A and Taylor Antoinette T
Bought by
Li Chung Cheng and Chang Chuan Ying
Home Financials for this Owner
Home Financials are based on the most recent Mortgage that was taken out on this home.
Original Mortgage
$209,250
Interest Rate
8.36%
Purchase Details
Closed on
Oct 28, 1998
Sold by
Heldmann Walter T and Heldmann Allyson G
Bought by
Taylor Daniel A and Taylor Antoinette T
Home Financials for this Owner
Home Financials are based on the most recent Mortgage that was taken out on this home.
Original Mortgage
$201,875
Interest Rate
6.61%
Purchase Details
Closed on
Dec 4, 1992
Bought by
Li Chung Cheng
Purchase Details
Closed on
Aug 31, 1992
Bought by
Li Chung Cheng
Purchase Details
Closed on
Feb 11, 1992
Bought by
Li Chung Cheng
Create a Home Valuation Report for This Property
The Home Valuation Report is an in-depth analysis detailing your home's value as well as a comparison with similar homes in the area
Home Values in the Area
Average Home Value in this Area
Purchase History
| Date | Buyer | Sale Price | Title Company |
|---|---|---|---|
| Li Chung Cheng | -- | -- | |
| Li Chung Cheng | $232,500 | Security Title | |
| Taylor Daniel A | $212,500 | Stewart Title | |
| Li Chung Cheng | $160,000 | -- | |
| Li Chung Cheng | $35,000 | -- | |
| Li Chung Cheng | -- | -- |
Source: Public Records
Mortgage History
| Date | Status | Borrower | Loan Amount |
|---|---|---|---|
| Previous Owner | Li Chung Cheng | $209,250 | |
| Previous Owner | Taylor Daniel A | $201,875 |
Source: Public Records
Tax History Compared to Growth
Tax History
| Year | Tax Paid | Tax Assessment Tax Assessment Total Assessment is a certain percentage of the fair market value that is determined by local assessors to be the total taxable value of land and additions on the property. | Land | Improvement |
|---|---|---|---|---|
| 2025 | $2,325 | $42,170 | -- | -- |
| 2024 | $2,299 | $42,560 | $5,360 | $37,200 |
| 2022 | $2,062 | $31,170 | $5,350 | $25,820 |
| 2021 | $2,292 | $32,070 | $5,510 | $26,560 |
| 2020 | $2,312 | $30,030 | $4,400 | $25,630 |
| 2019 | $2,287 | $30,030 | $4,400 | $25,630 |
| 2018 | $1,949 | $25,140 | $4,030 | $21,110 |
| 2017 | $1,941 | $25,140 | $4,030 | $21,110 |
| 2016 | $1,895 | $24,510 | $4,150 | $20,360 |
| 2015 | $1,891 | $24,510 | $4,150 | $20,360 |
| 2014 | $1,785 | $23,120 | $4,150 | $18,970 |
Source: Public Records
Map
Nearby Homes
- 2035 Springcrest Rd
- 2135 Springcrest Rd
- 2070 Alamosa Dr
- 2360 Pine Valley View
- 2479 Pine Valley View
- 1225 Montezuma Rd
- 2512 Willow Glen Dr
- 2631 Emerald Ridge Dr
- 2457 Craycroft Dr
- 2130 Wimbleton Ct
- 2032 Peridot Loop Heights
- 2712 Emerald Ridge Dr
- 9659 Carriage Creek Point
- 10645 Helenite Point
- 2240 Peridot Loop Heights
- 10544 Helenite Point
- 10554 Helenite Point
- 10546 Domeykite View
- 1996 Peridot Loop Heights
- 2560 Wimbleton Ct
- 1915 Springcrest Rd
- 9620 Daywood Ln
- 1895 Springcrest Rd
- 9604 Tall Trees Dr
- 1925 Springcrest Rd
- 9630 Daywood Ln
- 1930 Springcrest Rd
- 9610 Daywood Ln
- 1935 Springcrest Rd
- 2015 Surfwood Ln
- 1910 Springcrest Rd
- 1890 Springcrest Rd
- 1940 Springcrest Rd
- 2025 Surfwood Ln
- 9612 Tall Trees Dr
- 2030 Mulligan Dr
- 9615 Tall Trees Dr
- 2010 Mulligan Dr
- 1935 Spicewood Ln
- 9605 Daywood Ln