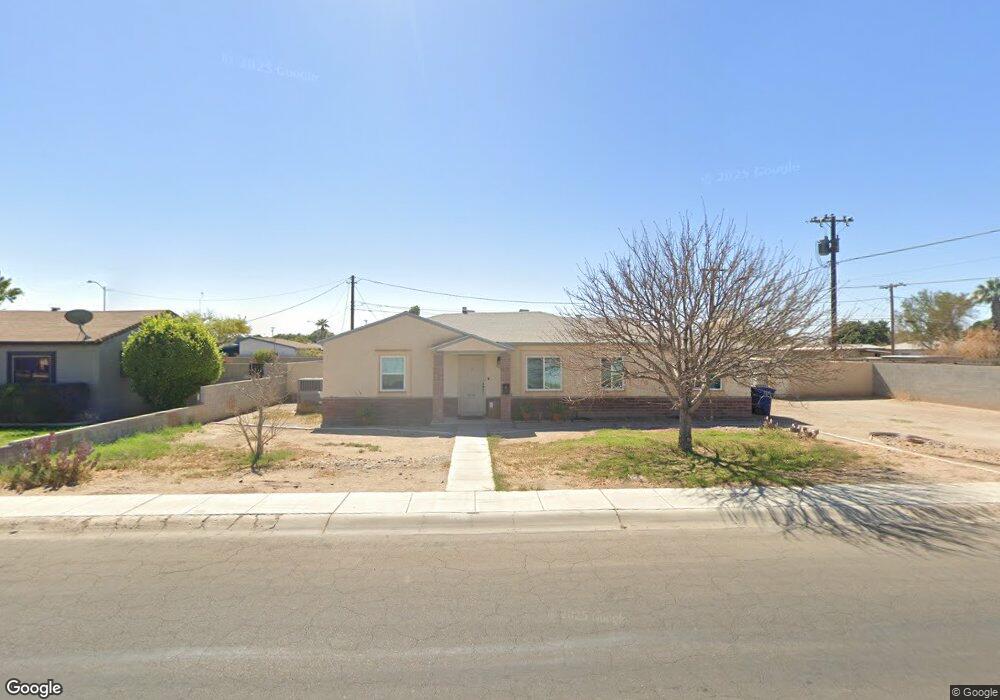
1905 W 5th St Yuma, AZ 85364
Townsend NeighborhoodEstimated Value: $187,569 - $197,000
3
Beds
2
Baths
1,201
Sq Ft
$160/Sq Ft
Est. Value
About This Home
This home is located at 1905 W 5th St, Yuma, AZ 85364 and is currently estimated at $192,392, approximately $160 per square foot. 1905 W 5th St is a home located in Yuma County with nearby schools including Pecan Grove Elementary School, Fourth Avenue Junior High School, and Yuma High School.
Ownership History
Date
Name
Owned For
Owner Type
Purchase Details
Closed on
Dec 4, 2005
Sold by
Rivera Jose G and Rivera Karen L
Bought by
Snook Edward W and Snook Tammy
Current Estimated Value
Home Financials for this Owner
Home Financials are based on the most recent Mortgage that was taken out on this home.
Original Mortgage
$103,200
Outstanding Balance
$55,634
Interest Rate
6.27%
Mortgage Type
New Conventional
Estimated Equity
$136,758
Purchase Details
Closed on
Jun 14, 2004
Sold by
Jorden Armon and Jorden Yvette
Bought by
Rivera Jose G and Rivera Karen L
Home Financials for this Owner
Home Financials are based on the most recent Mortgage that was taken out on this home.
Original Mortgage
$90,904
Interest Rate
6.27%
Mortgage Type
VA
Purchase Details
Closed on
Nov 30, 2001
Sold by
Gonzales Louis A and Gonzales Lori
Bought by
Jorden Armon and Jorden Yvette
Home Financials for this Owner
Home Financials are based on the most recent Mortgage that was taken out on this home.
Original Mortgage
$77,779
Interest Rate
7.11%
Mortgage Type
FHA
Create a Home Valuation Report for This Property
The Home Valuation Report is an in-depth analysis detailing your home's value as well as a comparison with similar homes in the area
Home Values in the Area
Average Home Value in this Area
Purchase History
| Date | Buyer | Sale Price | Title Company |
|---|---|---|---|
| Snook Edward W | $129,000 | Citizens Title | |
| Rivera Jose G | $88,000 | First American Title | |
| Jorden Armon | $79,000 | First American Title |
Source: Public Records
Mortgage History
| Date | Status | Borrower | Loan Amount |
|---|---|---|---|
| Open | Snook Edward W | $103,200 | |
| Previous Owner | Rivera Jose G | $90,904 | |
| Previous Owner | Jorden Armon | $77,779 | |
| Closed | Snook Edward W | $19,350 |
Source: Public Records
Tax History
| Year | Tax Paid | Tax Assessment Tax Assessment Total Assessment is a certain percentage of the fair market value that is determined by local assessors to be the total taxable value of land and additions on the property. | Land | Improvement |
|---|---|---|---|---|
| 2026 | $1,156 | $10,984 | $6,564 | $4,420 |
| 2025 | $1,107 | $10,461 | $2,196 | $8,265 |
| 2024 | $1,094 | $9,963 | $2,141 | $7,822 |
| 2023 | $1,094 | $9,488 | $2,190 | $7,298 |
| 2022 | $1,043 | $9,037 | $2,293 | $6,744 |
| 2021 | $1,093 | $8,607 | $2,068 | $6,539 |
| 2020 | $1,000 | $8,197 | $2,105 | $6,092 |
| 2019 | $986 | $7,807 | $2,321 | $5,486 |
| 2018 | $942 | $7,435 | $2,263 | $5,172 |
| 2017 | $903 | $7,435 | $2,263 | $5,172 |
| 2016 | $886 | $6,744 | $1,948 | $4,796 |
| 2015 | $740 | $6,422 | $1,789 | $4,633 |
| 2014 | $740 | $6,116 | $1,650 | $4,466 |
Source: Public Records
Map
Nearby Homes
- 502 S Magnolia Ave
- 566 S Magnolia Ave
- 410 S 22nd Ave
- 373 S Magnolia Ave
- 546 S 15th Ave
- 671 S 16th Ave
- 572 S 15th Ave
- 584 S Avenue B
- 187 S San Clemente Dr
- 650 S Avenue B
- 816 W 1st St
- 125 S 23rd Ave
- 965 S 20th Ave
- 1444 W 8th Place
- 1340 W 3rd St Unit 126
- 1458 W 9 St
- 1459 W 8th Place
- 1473 W 8th Place
- 1243 W 2nd St
- 31 S Avenue B Unit 31
- 1955 W 5th St
- 1901 W 5th St
- 1997 W 5th St
- 1906 W 5th Place
- 1902 W 5th Place
- 1910 W 5th Place
- 430 S 19th Ave
- 2003 W 5th St
- 1914 W 5th Place
- 415 S 20th Ave
- 426 S 19th Ave
- 2005 W 5 St
- 2005 W 5th St
- 1918 W 5th Place
- 413 S 20th Ave
- 505 S 19th Ave
- 501 S 19th Ave
- 509 S 19th Ave
- 433 S 19th Ave
- 422 S 19th Ave
Your Personal Tour Guide
Ask me questions while you tour the home.