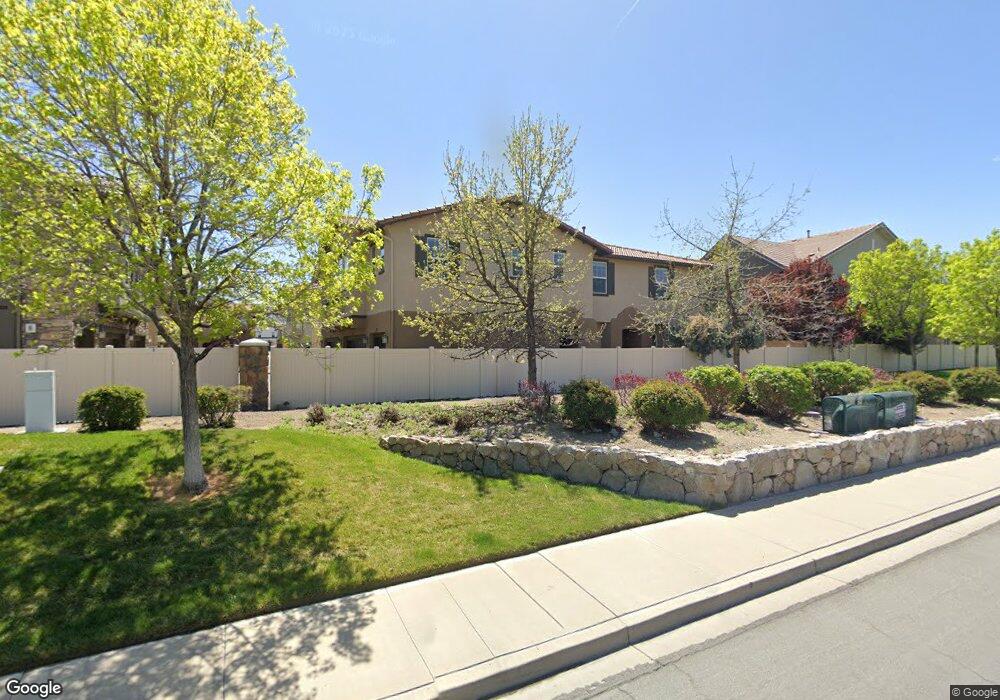
1905 Wind Ranch Rd Unit 2 Reno, NV 89521
Virginia Foothills NeighborhoodEstimated Value: $443,000 - $521,000
3
Beds
3
Baths
1,760
Sq Ft
$278/Sq Ft
Est. Value
About This Home
This home is located at 1905 Wind Ranch Rd Unit 2, Reno, NV 89521 and is currently estimated at $489,172, approximately $277 per square foot. 1905 Wind Ranch Rd Unit 2 is a home located in Washoe County with nearby schools including Jwood Raw Elementary School, Kendyl Depoali Middle School, and Damonte Ranch High School.
Ownership History
Date
Name
Owned For
Owner Type
Purchase Details
Closed on
Dec 9, 2016
Sold by
Cook Jeanette and Cook Kenneth
Bought by
Hehir Barry and Hehir Juliw
Current Estimated Value
Purchase Details
Closed on
May 16, 2015
Sold by
Smith Erika J and Smith Rodney L
Bought by
The Jeanette & Kenneth Cook Revocable Li
Purchase Details
Closed on
Feb 12, 2014
Sold by
Smith Rodney L and Smith Rodney
Bought by
Smith Erika J and Smith Rodney L
Purchase Details
Closed on
Sep 15, 2008
Sold by
D R Horton Inc Sacramento
Bought by
Smith Rodney
Home Financials for this Owner
Home Financials are based on the most recent Mortgage that was taken out on this home.
Original Mortgage
$210,920
Interest Rate
6.5%
Mortgage Type
FHA
Create a Home Valuation Report for This Property
The Home Valuation Report is an in-depth analysis detailing your home's value as well as a comparison with similar homes in the area
Home Values in the Area
Average Home Value in this Area
Purchase History
| Date | Buyer | Sale Price | Title Company |
|---|---|---|---|
| Hehir Barry | $260,000 | First Centennial Reno | |
| The Jeanette & Kenneth Cook Revocable Li | $250,000 | First Centennial Reno | |
| Smith Erika J | -- | None Available | |
| Smith Rodney | $214,500 | Ticor Title Reno |
Source: Public Records
Mortgage History
| Date | Status | Borrower | Loan Amount |
|---|---|---|---|
| Previous Owner | Smith Rodney | $210,920 |
Source: Public Records
Tax History
| Year | Tax Paid | Tax Assessment Tax Assessment Total Assessment is a certain percentage of the fair market value that is determined by local assessors to be the total taxable value of land and additions on the property. | Land | Improvement |
|---|---|---|---|---|
| 2026 | $2,113 | $101,313 | $29,925 | $71,388 |
| 2024 | $1,437 | $103,388 | $29,645 | $73,743 |
| 2023 | $2,092 | $98,931 | $33,950 | $64,981 |
| 2022 | $2,715 | $83,333 | $27,370 | $55,963 |
| 2021 | $2,517 | $78,557 | $22,610 | $55,947 |
| 2020 | $2,364 | $78,678 | $22,610 | $56,068 |
| 2019 | $2,289 | $77,024 | $22,330 | $54,694 |
| 2018 | $2,186 | $69,349 | $16,030 | $53,319 |
| 2017 | $2,096 | $67,703 | $15,155 | $52,548 |
| 2016 | $2,044 | $68,190 | $13,370 | $54,820 |
| 2015 | $2,044 | $65,899 | $11,970 | $53,929 |
| 2014 | $1,982 | $58,404 | $9,485 | $48,919 |
| 2013 | -- | $52,439 | $7,875 | $44,564 |
Source: Public Records
Map
Nearby Homes
- 1828 Wind Ranch Rd Unit C
- 1885 Sea Horse Rd Unit B
- 1860 Sea Horse Rd Unit C
- 1914 Sea Horse Rd Unit C
- 1750 Wind Ranch Rd Unit B
- 1991 Wind Ranch Rd Unit B
- 1960 Dark Horse Rd Unit A
- 10460 Mott Ct
- 1698 Silverthread Dr
- 10380 Rosemount Dr
- 10885 Pentwater Dr
- 10290 Culiacan Pass Trail
- 10260 Rollins Dr
- 1812 Braemore Dr
- 10900 Serratina Dr Unit 22
- 10005 Ellis Park Ln
- 1829 Resistol Dr
- 10806 Barrel Horse Ln
- 1588 Gemtown Ct
- 10755 Copper Lake Dr
- 1905 Wind Ranch Rd
- 1905 Wind Ranch Rd Unit 1
- 1905 Wind Ranch Rd Unit 3
- 1905 Wind Ranch Rd Unit B
- 1915 Wind Ranch Rd
- 1915 Wind Ranch Rd Unit 2
- 1915 Wind Ranch Rd Unit 1
- 1915 Wind Ranch Rd Unit 3
- 1915 Wind Ranch Rd Unit C
- 1915 Wind Ranch C Unit C
- 1915 Wind Ranch Rd Unit A
- 1875 Wind Ranch Rd Unit A
- 1875 Wind Ranch Rd
- 1875 Wind Ranch Rd Unit 3
- 1875 Wind Ranch Rd Unit 2
- 1875 Wind Ranch Rd Unit 1
- 1875 Wind Ranch Rd Unit B
- 1875 Wind Ranch Rd Unit C
- 1895 Wind Ranch Rd
- 1895 Wind Ranch Rd Unit 2
Your Personal Tour Guide
Ask me questions while you tour the home.