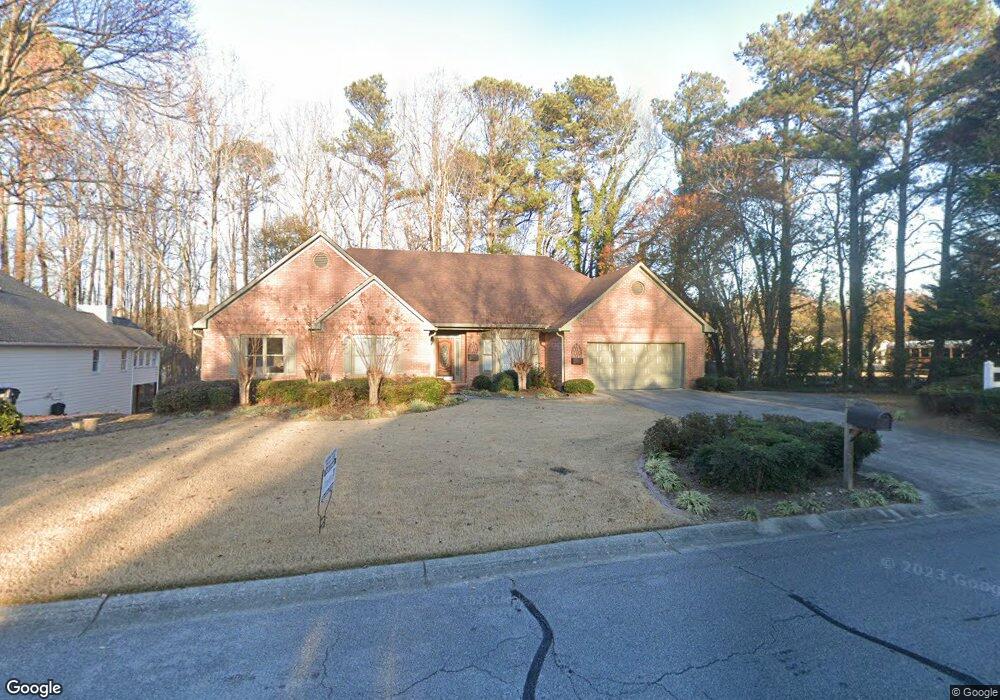
1905 Wynfield Point Dr Unit 1 Buford, GA 30519
Estimated Value: $428,000 - $446,329
3
Beds
2
Baths
2,988
Sq Ft
$147/Sq Ft
Est. Value
About This Home
This home is located at 1905 Wynfield Point Dr Unit 1, Buford, GA 30519 and is currently estimated at $438,082, approximately $146 per square foot. 1905 Wynfield Point Dr Unit 1 is a home located in Gwinnett County with nearby schools including Freeman's Mill Elementary School, Twin Rivers Middle School, and Mountain View High School.
Ownership History
Date
Name
Owned For
Owner Type
Purchase Details
Closed on
Jun 12, 2024
Sold by
Purchasing Fund 2023 2 Llc
Bought by
Dejean Michelle M
Current Estimated Value
Home Financials for this Owner
Home Financials are based on the most recent Mortgage that was taken out on this home.
Original Mortgage
$308,224
Outstanding Balance
$303,740
Interest Rate
7.02%
Mortgage Type
New Conventional
Estimated Equity
$134,342
Purchase Details
Closed on
Jan 29, 2024
Sold by
Gauntt Paul Phillip
Bought by
Purchasing Fund 2023 2 Llc
Purchase Details
Closed on
Sep 16, 1994
Sold by
Richardson Outler Prorps Inc
Bought by
Gauntt Paul P Bunny L
Home Financials for this Owner
Home Financials are based on the most recent Mortgage that was taken out on this home.
Original Mortgage
$104,900
Interest Rate
8.56%
Create a Home Valuation Report for This Property
The Home Valuation Report is an in-depth analysis detailing your home's value as well as a comparison with similar homes in the area
Home Values in the Area
Average Home Value in this Area
Purchase History
| Date | Buyer | Sale Price | Title Company |
|---|---|---|---|
| Dejean Michelle M | $440,320 | -- | |
| Purchasing Fund 2023 2 Llc | $430,000 | -- | |
| Gauntt Paul P Bunny L | $139,900 | -- |
Source: Public Records
Mortgage History
| Date | Status | Borrower | Loan Amount |
|---|---|---|---|
| Open | Dejean Michelle M | $308,224 | |
| Previous Owner | Gauntt Paul P Bunny L | $104,900 |
Source: Public Records
Tax History Compared to Growth
Tax History
| Year | Tax Paid | Tax Assessment Tax Assessment Total Assessment is a certain percentage of the fair market value that is determined by local assessors to be the total taxable value of land and additions on the property. | Land | Improvement |
|---|---|---|---|---|
| 2025 | $6,753 | $179,560 | $26,000 | $153,560 |
| 2024 | -- | $174,560 | $32,000 | $142,560 |
| 2023 | $930 | $175,720 | $32,000 | $143,720 |
| 2022 | $1,046 | $157,320 | $24,000 | $133,320 |
| 2021 | $1,028 | $134,280 | $20,000 | $114,280 |
| 2020 | $1,026 | $134,280 | $20,000 | $114,280 |
| 2019 | $954 | $108,680 | $16,800 | $91,880 |
| 2018 | $936 | $108,680 | $16,800 | $91,880 |
| 2016 | $976 | $96,920 | $16,800 | $80,120 |
| 2015 | $989 | $84,160 | $12,000 | $72,160 |
| 2014 | -- | $69,720 | $12,000 | $57,720 |
Source: Public Records
Map
Nearby Homes
- 2053 Arbor Springs Way
- 2066 Holland Creek Ct
- 1965 Holland Park Dr NE
- 1810 Sunset Harbour Pointe Unit 6
- 1867 Willoughby Dr
- 1846 Dorminey Ct Unit 2
- 1799 Braselton Hwy
- 1939 Sunny Hill Rd
- 1798 Braselton Hwy
- 2159 Sunny Hill Rd
- 1717 Willoughby Dr
- 2199 Sunny Hill Rd
- 1876 Hanover West Dr
- 1721 Crowes Lake Ct Unit 1
- 1716 Crowes Lake Ct
- 1580 Woodpoint Way
- 2170 Peachford Ln
- 2032 Shin Ct NE
- 1573 Vinings Ct
- 1820 Wellston Dr
- 1905 Wynfield Point Dr
- 1925 Wynfield Point Dr
- 1900 Wynfield Point Dr
- 1910 Wynfield Point Dr Unit 1
- 1920 Wynfield Point Dr
- 1945 Wynfield Point Dr Unit 1
- 1930 Wynfield Point Dr
- 1940 Wynfield Point Dr Unit 1
- 1955 Wynfield Point Dr
- 2021 Braselton Hwy
- 2063 Arbor Springs Way
- 1950 Wynfield Point Dr Unit 1/6
- 1950 Wynfield Point Dr
- 2073 Arbor Springs Way
- 2043 Arbor Springs Way
- 1965 Wynfield Point Dr Unit 1
- 2012 Binnies Way
- 2083 Arbor Springs Way
- 2022 Binnies Way
- 2042 Arbor Springs Way