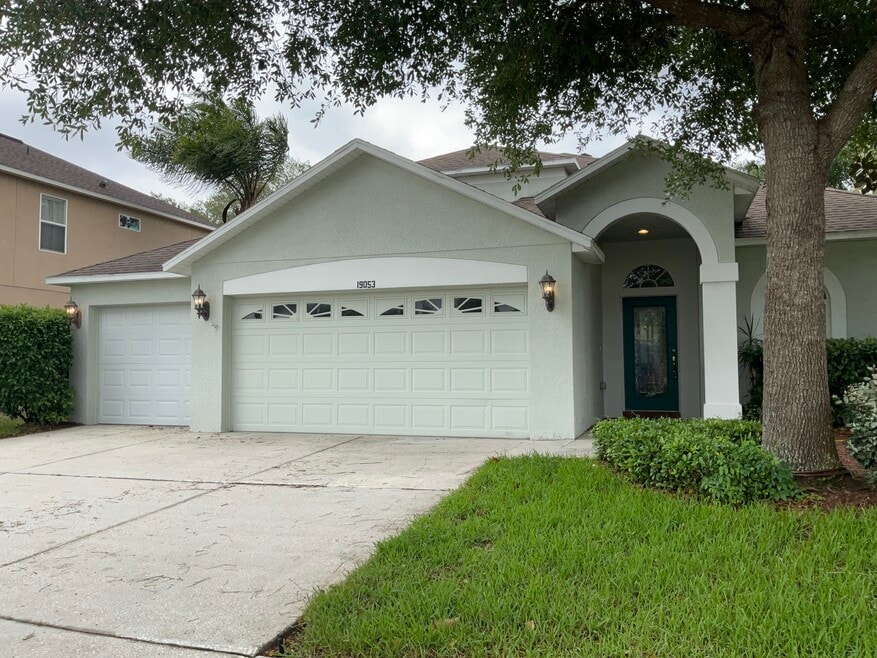


19053 Tilobe Loop Land O Lakes, FL 34638
About This Home
Special offer: Pay just $500 of your base rent (taxes and fees not included) as your security deposit, valid for new applicants who sign a 12-month lease by December 31, 2025. Offer is contingent on application approval and execution of a lease agreement. Other terms and conditions may apply. This property is professionally managed by AMH, a leading single-family rental company. We expect to make this property available for showings soon. We work to simplify your rental experience by offering self-guided tours and a streamlined leasing process you can complete all online, all on your own schedule. Once moved in, we provide maintenance support that you can rely on, so you can enjoy your weekends stress-free. We look forward to welcoming you home! Utilities, taxes, and other fees may apply. Please verify and confirm all information before signing a lease. If you have questions, don’t hesitate to contact us at the telephone number on this property listing. All lease applications, documentation, and initial payments for this property, must be submitted directly through or by phone. The photos, renderings, or other images of the properties on our website, are for illustrative purposes only, and may vary from the features, amenities, or phase of construction. We do not advertise properties on Craigslist, Facebook Marketplace, or other classified advertising websites. If you believe one of our residences is listed there, please notify us. For further description of applicable fees, please go to our website.

Map
- 18929 Parapet Place
- 19017 Sunterra Dr
- 9706 Simeon Dr
- 9329 Wellstone Dr
- 9711 Simeon Dr
- 18833 Litzau Ln
- 18930 Narimore Dr
- 9314 Black Thorn Loop
- 9863 Asbel Estates St
- 9224 Lost Mill Dr
- 19522 Timberbluff Dr
- 9208 Lost Mill Dr
- 19551 Timberbluff Dr
- 9142 Lantern Oak Way
- 9613 Jasmine Brook Cir
- 9211 Seeger Ln
- 18901 New Passage Blvd
- 9110 Lantern Oak Way
- 9840 Jasmine Brook Cir
- 9954 Jasmine Brook Cir
- 9432 Wellstone Dr
- 9742 Simeon Dr
- 9243 Wellstone Dr
- 18816 Litzau Ln
- 19044 Dunlap Ct
- 9133 Bell Rock Place
- 19412 Timberbluff Dr
- 9135 Mirah Wind Place
- 9207 Seeger Ln
- 19706 Timberbluff Dr
- 10017 Coldwater Loop
- 18356 Cypress Bay Pkwy
- 18772 Grand Live Oak Blvd Unit B1.2
- 18772 Grand Live Oak Blvd Unit C3
- 18772 Grand Live Oak Blvd Unit A2.1
- 18872 Grand Oak Blvd
- 18108 Cypress Bay Pkwy
- 17737 Turning Leaf Cir
- 22083 Nebula Way
- 17897 Turning Leaf Cir