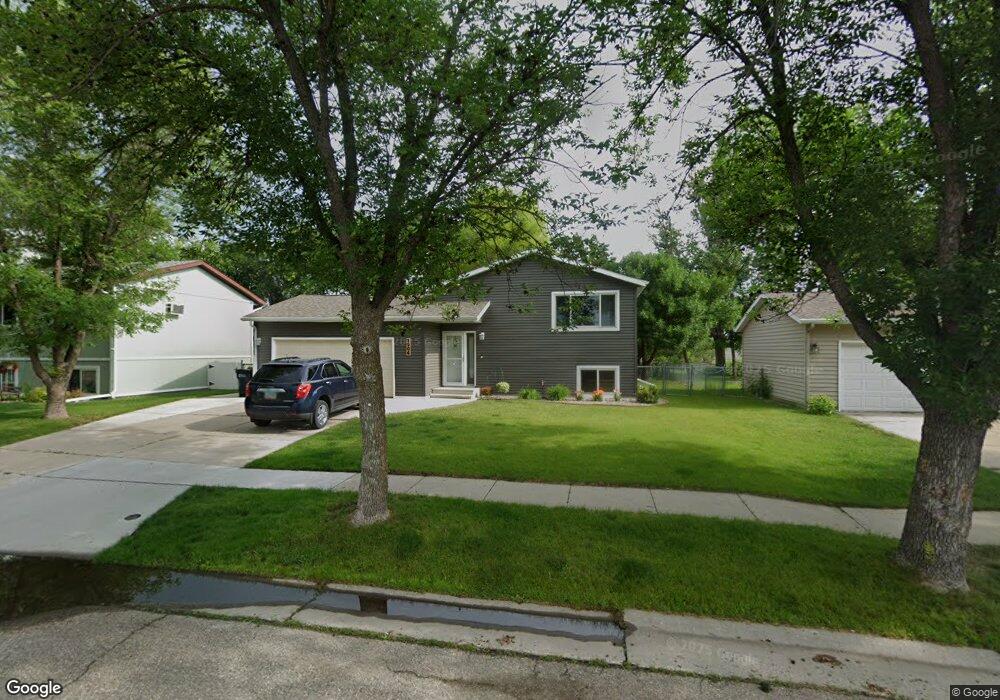
1906 4th Ave E West Fargo, ND 58078
Meadowridge NeighborhoodEstimated Value: $246,000 - $273,153
3
Beds
2
Baths
1,344
Sq Ft
$193/Sq Ft
Est. Value
About This Home
This home is located at 1906 4th Ave E, West Fargo, ND 58078 and is currently estimated at $259,577, approximately $193 per square foot. 1906 4th Ave E is a home located in Cass County with nearby schools including L.E. Berger Elementary School, Cheney Middle School, and West Fargo High School.
Ownership History
Date
Name
Owned For
Owner Type
Purchase Details
Closed on
Jan 18, 2024
Sold by
Hoekstra Stephanie L and Hoekstra Samuel M
Bought by
Hoekstra Stephanie L and Hoekstra Samuel M
Current Estimated Value
Home Financials for this Owner
Home Financials are based on the most recent Mortgage that was taken out on this home.
Original Mortgage
$85,000
Outstanding Balance
$79,004
Interest Rate
6.29%
Mortgage Type
Credit Line Revolving
Estimated Equity
$180,573
Purchase Details
Closed on
May 18, 2012
Sold by
Anderson Justin M and Johnson Rhiannon L
Bought by
Dirks Stephanie L
Home Financials for this Owner
Home Financials are based on the most recent Mortgage that was taken out on this home.
Original Mortgage
$120,758
Interest Rate
4.5%
Mortgage Type
FHA
Create a Home Valuation Report for This Property
The Home Valuation Report is an in-depth analysis detailing your home's value as well as a comparison with similar homes in the area
Home Values in the Area
Average Home Value in this Area
Purchase History
| Date | Buyer | Sale Price | Title Company |
|---|---|---|---|
| Hoekstra Stephanie L | -- | None Listed On Document | |
| Dirks Stephanie L | $123,900 | Us Title |
Source: Public Records
Mortgage History
| Date | Status | Borrower | Loan Amount |
|---|---|---|---|
| Open | Hoekstra Stephanie L | $85,000 | |
| Previous Owner | Dirks Stephanie L | $120,758 |
Source: Public Records
Tax History Compared to Growth
Tax History
| Year | Tax Paid | Tax Assessment Tax Assessment Total Assessment is a certain percentage of the fair market value that is determined by local assessors to be the total taxable value of land and additions on the property. | Land | Improvement |
|---|---|---|---|---|
| 2024 | $2,198 | $93,700 | $18,350 | $75,350 |
| 2023 | $2,629 | $90,350 | $18,350 | $72,000 |
| 2022 | $2,566 | $84,300 | $18,350 | $65,950 |
| 2021 | $2,514 | $79,400 | $14,100 | $65,300 |
| 2020 | $2,407 | $77,500 | $14,100 | $63,400 |
| 2019 | $2,307 | $75,100 | $14,100 | $61,000 |
| 2018 | $2,224 | $74,500 | $14,100 | $60,400 |
| 2017 | $2,169 | $73,900 | $14,100 | $59,800 |
| 2016 | $1,896 | $72,200 | $14,100 | $58,100 |
| 2015 | $1,798 | $66,150 | $11,650 | $54,500 |
| 2014 | $1,762 | $61,800 | $11,650 | $50,150 |
| 2013 | $1,689 | $58,000 | $10,250 | $47,750 |
Source: Public Records
Map
Nearby Homes
- 2120 4th Ave E
- 1726 2nd Ave E
- 2150 2nd Ave E
- 432 22nd St E
- 1438 Suntree Dr
- 1332 Sandstone Dr
- 4836 9th Ave S
- 4704 8th Ave S
- 921 Homestead Ct
- 1059 Sommerset Place
- 1511 11th Ave E
- 341 Santa Cruz Dr Unit 305
- 801 9th St E
- 851 12th Ave E
- 987 14th Ave E
- 670 13th Ave E
- 426 3rd Ave E
- 437 10th Ave E
- 924 10th Ave NE
- 1522 Baywood Dr
- 1900 4th Ave E
- 1914 4th Ave E
- 1907 3rd Ave E
- 1920 4th Ave E
- 1812 4th Ave E
- 1901 3rd Ave E
- 1921 3rd Ave E
- 1901 4th Ave E
- 1806 4th Ave E
- 1907 4th Ave E
- 2000 4th Ave E
- 1913 4th Ave E
- 1807 3rd Ave E
- 400 400 19-Street-e
- 400 19th St E
- 1919 4th Ave E
- 245 19th St E
- 303 18th St E
- 2006 4th Ave E
- 246 20th St E