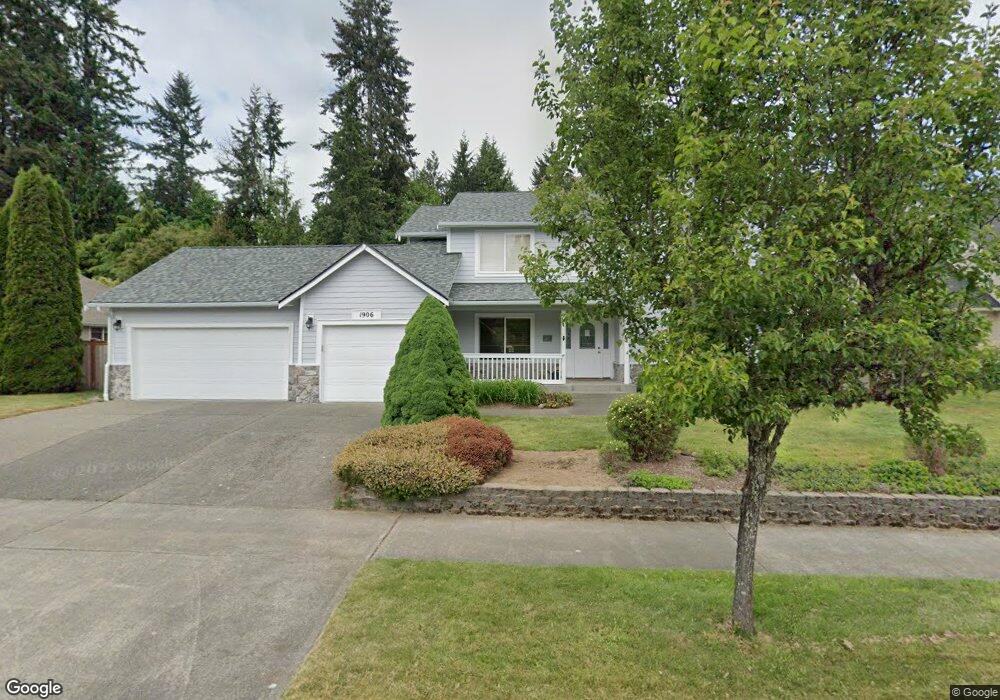
1906 54th Ln SE Olympia, WA 98501
Estimated Value: $704,000 - $768,000
4
Beds
3
Baths
2,392
Sq Ft
$309/Sq Ft
Est. Value
About This Home
This home is located at 1906 54th Ln SE, Olympia, WA 98501 and is currently estimated at $738,035, approximately $308 per square foot. 1906 54th Ln SE is a home located in Thurston County with nearby schools including Centennial Elementary School, Washington Middle School, and Olympia High School.
Ownership History
Date
Name
Owned For
Owner Type
Purchase Details
Closed on
Feb 15, 2002
Sold by
Estep Tom and Estep Kimberly A
Bought by
Harrington Timothy B and Harrington Kim
Current Estimated Value
Home Financials for this Owner
Home Financials are based on the most recent Mortgage that was taken out on this home.
Original Mortgage
$204,000
Outstanding Balance
$84,769
Interest Rate
7.13%
Estimated Equity
$653,266
Purchase Details
Closed on
Oct 30, 2001
Sold by
Friend John
Bought by
Estep Tom and Estep Kimberly A
Home Financials for this Owner
Home Financials are based on the most recent Mortgage that was taken out on this home.
Original Mortgage
$203,900
Interest Rate
6.84%
Mortgage Type
Construction
Purchase Details
Closed on
Mar 14, 2000
Sold by
M D N Inc
Bought by
Friend & Friend Enterprises Inc
Create a Home Valuation Report for This Property
The Home Valuation Report is an in-depth analysis detailing your home's value as well as a comparison with similar homes in the area
Home Values in the Area
Average Home Value in this Area
Purchase History
| Date | Buyer | Sale Price | Title Company |
|---|---|---|---|
| Harrington Timothy B | $255,000 | Pioneer Title Company | |
| Estep Tom | $62,500 | Pioneer Title Company | |
| Friend & Friend Enterprises Inc | -- | -- |
Source: Public Records
Mortgage History
| Date | Status | Borrower | Loan Amount |
|---|---|---|---|
| Open | Harrington Timothy B | $204,000 | |
| Previous Owner | Estep Tom | $203,900 | |
| Closed | Harrington Timothy B | $38,250 |
Source: Public Records
Tax History Compared to Growth
Tax History
| Year | Tax Paid | Tax Assessment Tax Assessment Total Assessment is a certain percentage of the fair market value that is determined by local assessors to be the total taxable value of land and additions on the property. | Land | Improvement |
|---|---|---|---|---|
| 2024 | $6,923 | $689,300 | $186,900 | $502,400 |
| 2023 | $6,923 | $666,600 | $188,800 | $477,800 |
| 2022 | $6,556 | $683,600 | $146,200 | $537,400 |
| 2021 | $5,879 | $556,100 | $121,900 | $434,200 |
| 2020 | $5,930 | $457,300 | $94,000 | $363,300 |
| 2019 | $5,425 | $454,700 | $118,800 | $335,900 |
| 2018 | $6,289 | $465,100 | $86,300 | $378,800 |
| 2017 | $5,888 | $449,550 | $87,450 | $362,100 |
| 2016 | $5,470 | $408,400 | $91,700 | $316,700 |
| 2014 | -- | $413,750 | $93,150 | $320,600 |
Source: Public Records
Map
Nearby Homes
- 5113 Brassfield Dr SE
- 2433 55th Ave SE
- 2638 58th Ct SE
- 2427 Boulevard Heights Loop SE
- 4509 Briggs Dr SE
- 4932 Siskiyou Loop SE
- 2825 Haig Dr SE
- 2835 60th Ln SE Unit A
- 2745 45th Ave SE
- 802 Silo Ct SE
- 1533 Vineyard Ave SE
- 4700 Delta Ln SE
- 4708 Delta Ln SE
- 4507 Trenton Loop SE
- 4901 Delta Ln SE
- 3820 Kingsbury Ln SE
- 4711 Cleveland Ave SE
- 1111 68th (Lot 13) Loop SE
- 1156 68th Loop SE Unit 43
- The Cristina Plan at Three Lakes Crossing
- 1906 54th Ln SE
- 1910 54th Ln SE
- 1904 54th Ln SE
- 1905 54th Ln SE
- 1905 54th Ln SE
- 1914 54th Ln SE
- 1902 54th Ln SE
- 1915 54th Ln SE
- 1903 54th Ln SE
- 1901 54th Ln SE
- 1901 54th Ln SE
- 1918 54th Ln SE
- 1925 54th Ln SE
- 5506 Cheri Estates Dr SE
- 5448 Cheri Estates Dr SE
- 5510 Cheri Estates Dr SE
- 5242 Brassfield Dr SE
- 1835 53rd Loop SE
- 5236 Brassfield Dr SE
- 1831 53rd Loop SE