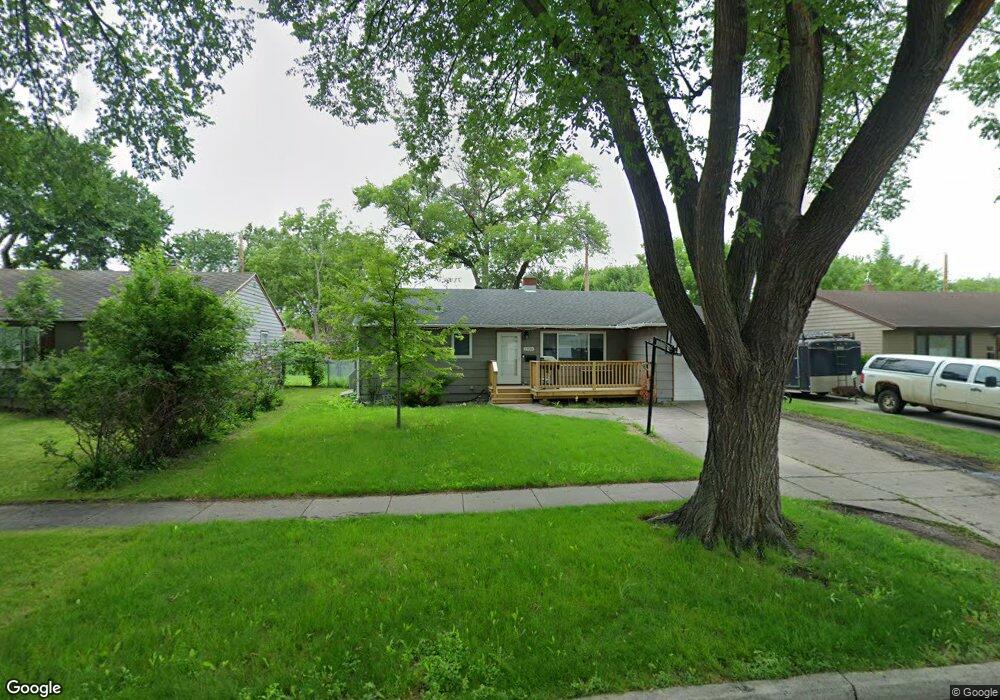
1906 8th St N Fargo, ND 58102
Northport NeighborhoodEstimated Value: $236,074 - $260,000
3
Beds
2
Baths
1,001
Sq Ft
$249/Sq Ft
Est. Value
About This Home
This home is located at 1906 8th St N, Fargo, ND 58102 and is currently estimated at $249,519, approximately $249 per square foot. 1906 8th St N is a home located in Cass County with nearby schools including Washington Elementary School, Ben Franklin Middle School, and North High School.
Ownership History
Date
Name
Owned For
Owner Type
Purchase Details
Closed on
Jun 24, 2022
Sold by
Hilt and Sheila
Bought by
Hilt Mark J and Hilt Elizabeth A
Current Estimated Value
Purchase Details
Closed on
Aug 24, 2011
Sold by
Nelson Sue E
Bought by
Hilt Thomas and Hilt Sheila
Create a Home Valuation Report for This Property
The Home Valuation Report is an in-depth analysis detailing your home's value as well as a comparison with similar homes in the area
Home Values in the Area
Average Home Value in this Area
Purchase History
| Date | Buyer | Sale Price | Title Company |
|---|---|---|---|
| Hilt Mark J | -- | Ohnstad Twichell Pc | |
| Hilt Thomas | -- | None Available |
Source: Public Records
Tax History Compared to Growth
Tax History
| Year | Tax Paid | Tax Assessment Tax Assessment Total Assessment is a certain percentage of the fair market value that is determined by local assessors to be the total taxable value of land and additions on the property. | Land | Improvement |
|---|---|---|---|---|
| 2024 | $3,221 | $108,800 | $24,950 | $83,850 |
| 2023 | $3,041 | $102,650 | $24,950 | $77,700 |
| 2022 | $2,929 | $96,850 | $24,950 | $71,900 |
| 2021 | $2,807 | $94,050 | $24,950 | $69,100 |
| 2020 | $2,479 | $87,900 | $24,950 | $62,950 |
| 2019 | $2,365 | $87,900 | $13,850 | $74,050 |
| 2018 | $2,130 | $78,500 | $13,850 | $64,650 |
| 2017 | $1,961 | $76,200 | $13,850 | $62,350 |
| 2016 | $1,635 | $69,250 | $13,850 | $55,400 |
| 2015 | $1,797 | $69,250 | $10,400 | $58,850 |
| 2014 | $1,914 | $72,050 | $10,400 | $61,650 |
| 2013 | $1,826 | $68,600 | $10,400 | $58,200 |
Source: Public Records
Map
Nearby Homes