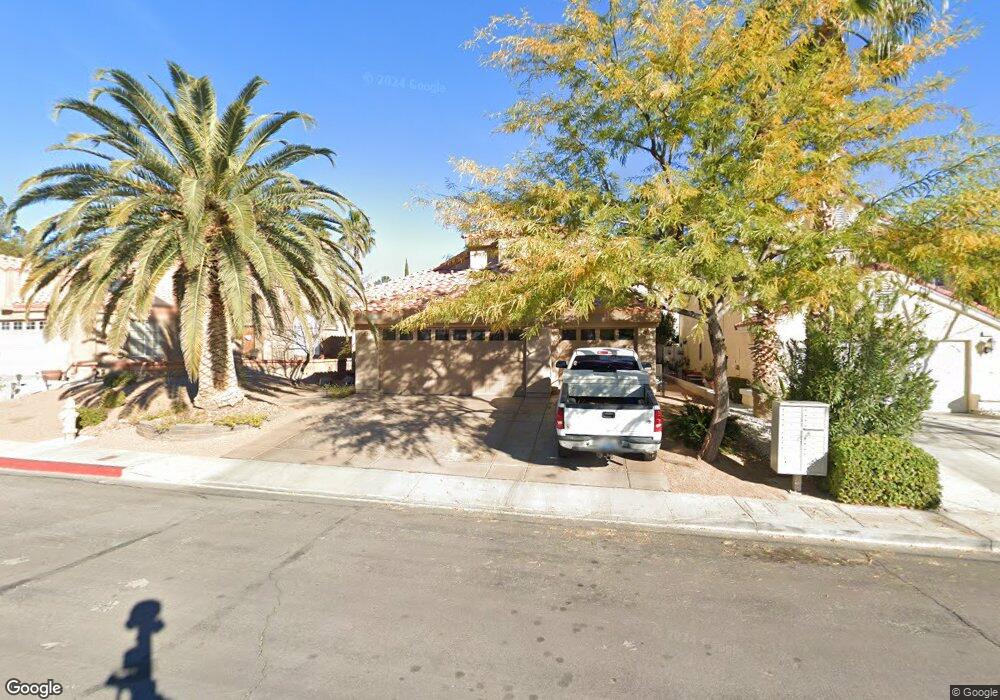
1906 Allen Grove Ct Henderson, NV 89074
Green Valley North NeighborhoodEstimated Value: $558,000 - $592,000
4
Beds
3
Baths
2,141
Sq Ft
$268/Sq Ft
Est. Value
About This Home
This home is located at 1906 Allen Grove Ct, Henderson, NV 89074 and is currently estimated at $572,846, approximately $267 per square foot. 1906 Allen Grove Ct is a home located in Clark County with nearby schools including James Gibson Elementary School, Barbara and Hank Greenspun Junior High School, and Green Valley High School.
Ownership History
Date
Name
Owned For
Owner Type
Purchase Details
Closed on
May 27, 2022
Sold by
Gates Daniel W
Bought by
Nichol William M and Nichol Nicole
Current Estimated Value
Home Financials for this Owner
Home Financials are based on the most recent Mortgage that was taken out on this home.
Original Mortgage
$501,930
Outstanding Balance
$476,448
Interest Rate
5%
Mortgage Type
VA
Estimated Equity
$96,398
Purchase Details
Closed on
Nov 3, 2021
Sold by
Gates Tamy M
Bought by
Gates Daniel W
Home Financials for this Owner
Home Financials are based on the most recent Mortgage that was taken out on this home.
Original Mortgage
$265,000
Interest Rate
2.88%
Mortgage Type
New Conventional
Purchase Details
Closed on
Feb 27, 2002
Sold by
Winters Ralph Lash and Winters Linda G
Bought by
Gates Daniel W and Gates Tamy M
Home Financials for this Owner
Home Financials are based on the most recent Mortgage that was taken out on this home.
Original Mortgage
$152,000
Interest Rate
6.94%
Create a Home Valuation Report for This Property
The Home Valuation Report is an in-depth analysis detailing your home's value as well as a comparison with similar homes in the area
Home Values in the Area
Average Home Value in this Area
Purchase History
| Date | Buyer | Sale Price | Title Company |
|---|---|---|---|
| Nichol William M | $570,000 | Equity Title | |
| Gates Daniel W | -- | Equity Title Of Nevada | |
| Gates Daniel W | $190,000 | Lawyers Title |
Source: Public Records
Mortgage History
| Date | Status | Borrower | Loan Amount |
|---|---|---|---|
| Open | Nichol William M | $501,930 | |
| Previous Owner | Gates Daniel W | $265,000 | |
| Previous Owner | Gates Daniel W | $152,000 |
Source: Public Records
Tax History Compared to Growth
Tax History
| Year | Tax Paid | Tax Assessment Tax Assessment Total Assessment is a certain percentage of the fair market value that is determined by local assessors to be the total taxable value of land and additions on the property. | Land | Improvement |
|---|---|---|---|---|
| 2025 | $2,170 | $109,578 | $39,900 | $69,678 |
| 2024 | $2,107 | $109,578 | $39,900 | $69,678 |
| 2023 | $2,107 | $101,875 | $35,000 | $66,875 |
| 2022 | $2,145 | $92,484 | $30,660 | $61,824 |
| 2021 | $1,987 | $87,253 | $28,000 | $59,253 |
| 2020 | $1,926 | $86,444 | $27,300 | $59,144 |
| 2019 | $1,870 | $82,543 | $23,800 | $58,743 |
| 2018 | $1,815 | $77,207 | $20,300 | $56,907 |
| 2017 | $2,254 | $77,759 | $19,600 | $58,159 |
| 2016 | $1,720 | $71,659 | $12,950 | $58,709 |
| 2015 | $1,716 | $67,755 | $10,500 | $57,255 |
| 2014 | $1,666 | $55,784 | $10,325 | $45,459 |
Source: Public Records
Map
Nearby Homes
- 1939 Guinn Dr
- 322 Oliveiro Ct
- 1831 Escondido Terrace
- 272 Grand Teton Dr
- 1832 Muchacha Dr
- 347 Gana Ct Unit B
- 1926 Navarre Ln
- 1809 Nuevo Rd
- 1810 Nuevo Rd
- 271 Sunshine Springs Ct
- 327 Fuente Dr
- 1952 Barranca Dr
- 316 Santa Monica Dr
- 2108 Running River Rd
- 325 Esquina Dr
- 322 Esquina Dr
- 1795 Nuevo Rd
- 372 Rushing Creek Ct
- 259 Spring Hills Ln
- 374 Santali Ct
- 1908 Allen Grove Ct
- 1904 Allen Grove Ct
- 292 Belair View Ct
- 1910 Allen Grove Ct
- 1902 Allen Grove Ct Unit 1
- 291 Belair View Ct
- 294 Belair View Ct
- 1907 Allen Grove Ct
- 1912 Allen Grove Ct
- 1905 Allen Grove Ct
- 285 Grantwood Dr
- 1909 Allen Grove Ct
- 1903 Allen Grove Ct
- 1911 Allen Grove Ct
- 296 Belair View Ct
- 287 Grantwood Dr
- 286 Kershner Ct
- 295 Belair View Ct
- 1901 Allen Grove Ct