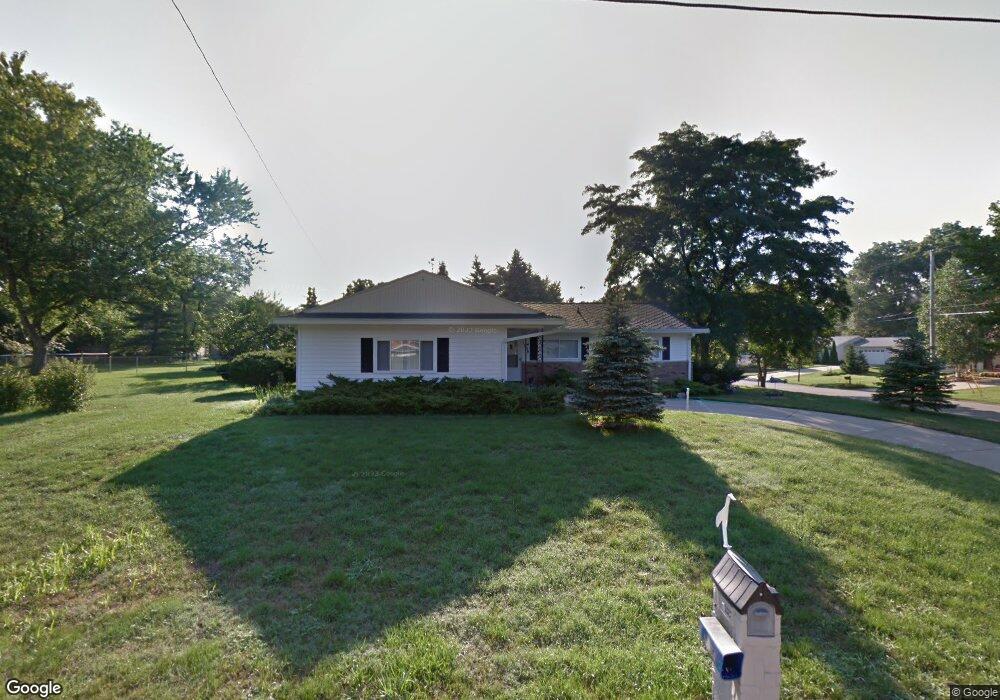
1906 Byrnes Rd Lansing, MI 48906
Northwestside NeighborhoodEstimated Value: $233,885 - $272,000
Studio
1
Bath
1,514
Sq Ft
$169/Sq Ft
Est. Value
About This Home
This home is located at 1906 Byrnes Rd, Lansing, MI 48906 and is currently estimated at $255,971, approximately $169 per square foot. 1906 Byrnes Rd is a home located in Ingham County with nearby schools including Cumberland Elementary School, Pattengill Academy, and J.W. Sexton High School.
Ownership History
Date
Name
Owned For
Owner Type
Purchase Details
Closed on
Aug 21, 2019
Sold by
Woodworth Donald M
Bought by
Willis Rachel R and Willis Mack A
Current Estimated Value
Home Financials for this Owner
Home Financials are based on the most recent Mortgage that was taken out on this home.
Original Mortgage
$169,375
Outstanding Balance
$148,341
Interest Rate
3.7%
Mortgage Type
FHA
Estimated Equity
$107,630
Purchase Details
Closed on
Jan 15, 2008
Sold by
Woodworth Donald M and Woodworth Mary E
Bought by
Woodworth Donald M
Purchase Details
Closed on
Sep 21, 2007
Sold by
Woodworth Donald M and Woodworth Mary E
Bought by
Dorsa William F
Purchase Details
Closed on
Jul 21, 2005
Sold by
Krause Fred and Krause Margaret
Bought by
Woodworth Donald M and Woodworth Mary E
Purchase Details
Closed on
Aug 2, 2002
Sold by
Krause Fred and Krause Margaret J
Bought by
Krause Fred and Krause Margaret J
Create a Home Valuation Report for This Property
The Home Valuation Report is an in-depth analysis detailing your home's value as well as a comparison with similar homes in the area
Home Values in the Area
Average Home Value in this Area
Purchase History
| Date | Buyer | Sale Price | Title Company |
|---|---|---|---|
| Willis Rachel R | $172,500 | Transnation Title Agency | |
| Woodworth Donald M | -- | None Available | |
| Dorsa William F | -- | First Am Title | |
| Woodworth Donald M | $160,000 | -- | |
| Krause Fred | -- | -- |
Source: Public Records
Mortgage History
| Date | Status | Borrower | Loan Amount |
|---|---|---|---|
| Open | Willis Rachel R | $169,375 |
Source: Public Records
Tax History
| Year | Tax Paid | Tax Assessment Tax Assessment Total Assessment is a certain percentage of the fair market value that is determined by local assessors to be the total taxable value of land and additions on the property. | Land | Improvement |
|---|---|---|---|---|
| 2025 | $5,696 | $115,900 | $22,500 | $93,400 |
| 2024 | $46 | $99,700 | $22,500 | $77,200 |
| 2023 | $5,336 | $93,500 | $22,500 | $71,000 |
| 2022 | $4,803 | $85,500 | $13,200 | $72,300 |
| 2021 | $4,703 | $81,500 | $10,300 | $71,200 |
| 2020 | $4,675 | $76,300 | $11,600 | $64,700 |
| 2019 | $3,319 | $72,700 | $11,600 | $61,100 |
| 2018 | $3,108 | $67,800 | $11,600 | $56,200 |
| 2017 | $2,976 | $67,800 | $11,600 | $56,200 |
| 2016 | $2,846 | $57,200 | $11,600 | $45,600 |
| 2015 | $2,846 | $53,700 | $23,170 | $30,530 |
| 2014 | $2,846 | $51,100 | $26,259 | $24,841 |
Source: Public Records
Map
Nearby Homes
- 1920 Byrnes Rd
- 2206 Kuerbitz Dr
- 2302 Northwest Ave
- 2300 Byrnes Rd
- 2800 Tecumseh River Rd
- 1805 Boynton Dr
- 2313 Kuerbitz Dr
- 3116 Colchester Rd
- 3500 Colchester Rd
- 3723 Springbrook Ln
- 2601 Newport Dr
- 1930 Briarwood Dr
- 2817 W Willow St
- 1115 Boynton Dr
- 1222 Ravenswood Dr
- 1109 Westfield Rd
- 3733 Colchester Rd
- 1015 Westfield Rd
- 3003 Timber Dr
- 3017 Alfred Ave
- 3134 Tecumseh River Rd
- 3128 Tecumseh River Rd
- 3200 Tecumseh River Rd
- 1911 Beacon Hill Dr
- 1919 Byrnes Rd
- 1921 Beacon Hill Dr
- 1905 Beacon Hill Dr
- 3141 Tecumseh River Rd
- 1930 Byrnes Rd
- 3137 Tecumseh River Rd
- 3201 Tecumseh River Rd
- 1931 Beacon Hill Dr
- 3129 Tecumseh River Rd
- 3217 Tecumseh River Rd
- 3236 Tecumseh River Rd
- 3125 Tecumseh River Rd
- 1937 Byrnes Rd
Your Personal Tour Guide
Ask me questions while you tour the home.