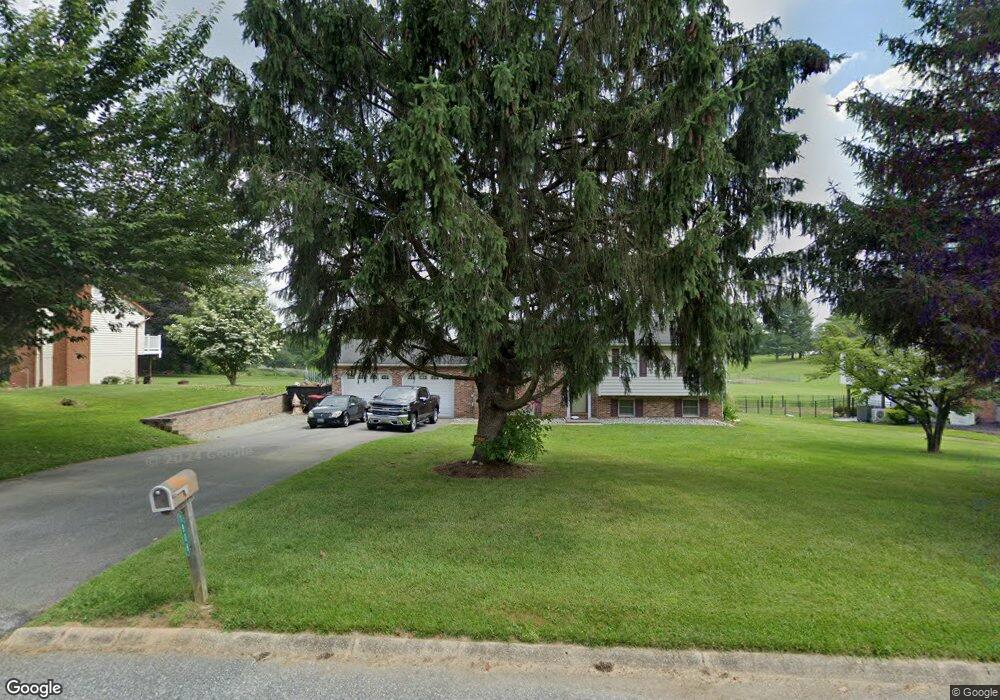
1906 Devoe Ct Jarrettsville, MD 21084
Estimated Value: $443,000 - $492,000
--
Bed
3
Baths
1,155
Sq Ft
$407/Sq Ft
Est. Value
About This Home
This home is located at 1906 Devoe Ct, Jarrettsville, MD 21084 and is currently estimated at $470,184, approximately $407 per square foot. 1906 Devoe Ct is a home located in Harford County with nearby schools including North Bend Elementary School, North Harford Middle School, and North Harford High School.
Ownership History
Date
Name
Owned For
Owner Type
Purchase Details
Closed on
Jun 1, 2006
Sold by
Goetz Mark H
Bought by
Keeney David A and Keeney Michele D
Current Estimated Value
Home Financials for this Owner
Home Financials are based on the most recent Mortgage that was taken out on this home.
Original Mortgage
$297,600
Outstanding Balance
$173,295
Interest Rate
6.4%
Mortgage Type
Purchase Money Mortgage
Estimated Equity
$296,889
Purchase Details
Closed on
Apr 28, 2006
Sold by
Goetz Mark H
Bought by
Keeney David A and Keeney Michele D
Home Financials for this Owner
Home Financials are based on the most recent Mortgage that was taken out on this home.
Original Mortgage
$297,600
Outstanding Balance
$173,295
Interest Rate
6.4%
Mortgage Type
Purchase Money Mortgage
Estimated Equity
$296,889
Purchase Details
Closed on
Jul 21, 1998
Sold by
Blanc Paul R
Bought by
Goetz Mark H and Goetz Kellye A
Purchase Details
Closed on
Mar 27, 1996
Sold by
Awalt Thomas R
Bought by
Blanc Paul R and Blanc Julia T
Create a Home Valuation Report for This Property
The Home Valuation Report is an in-depth analysis detailing your home's value as well as a comparison with similar homes in the area
Home Values in the Area
Average Home Value in this Area
Purchase History
| Date | Buyer | Sale Price | Title Company |
|---|---|---|---|
| Keeney David A | $372,000 | -- | |
| Keeney David A | $372,000 | -- | |
| Goetz Mark H | $190,000 | -- | |
| Blanc Paul R | $174,900 | -- |
Source: Public Records
Mortgage History
| Date | Status | Borrower | Loan Amount |
|---|---|---|---|
| Open | Keeney David A | $297,600 | |
| Closed | Keeney David A | $297,600 | |
| Closed | Blanc Paul R | -- |
Source: Public Records
Tax History Compared to Growth
Tax History
| Year | Tax Paid | Tax Assessment Tax Assessment Total Assessment is a certain percentage of the fair market value that is determined by local assessors to be the total taxable value of land and additions on the property. | Land | Improvement |
|---|---|---|---|---|
| 2025 | $3,636 | $345,733 | $0 | $0 |
| 2024 | $3,636 | $328,100 | $107,400 | $220,700 |
| 2023 | $3,554 | $320,567 | $0 | $0 |
| 2022 | $3,472 | $313,033 | $0 | $0 |
| 2021 | $3,516 | $305,500 | $107,400 | $198,100 |
| 2020 | $3,516 | $299,467 | $0 | $0 |
| 2019 | $3,446 | $293,433 | $0 | $0 |
| 2018 | $3,347 | $287,400 | $119,700 | $167,700 |
| 2017 | $3,260 | $287,400 | $0 | $0 |
| 2016 | -- | $272,200 | $0 | $0 |
| 2015 | $3,375 | $264,600 | $0 | $0 |
| 2014 | $3,375 | $264,600 | $0 | $0 |
Source: Public Records
Map
Nearby Homes
- 1905 Youngston Rd
- 4065 Federal Hill Rd
- 3917 Federal Hill Rd
- 4108 Federal Hill Rd
- 1523 N Bend Rd
- 4101 Federal Hill Rd
- 3961 Old Federal Hill Rd
- 1412 N Bend Rd
- 1372 N Bend Rd
- 1362 Rockridge Rd
- 4106 Overlook Dr
- 3863 Old Federal Hill Rd
- 3853 Old Federal Hill Rd
- 1431A Knopp Rd Unit A
- 1312 Rockridge Rd
- 4031, 4033 & 4035 Norrisville Rd
- 4246 Madonna Rd
- 4319 Federal Hill Rd
- 1221 Chrome Hill Rd
- 4035, 4033 & 4031 Norrisville Rd
- 1904 Devoe Ct
- 1908 Devoe Ct
- 1902 Devoe Ct
- 1905 Devoe Ct
- 1910 Devoe Ct
- 1907 Devoe Ct
- 1903 Devoe Ct
- 4021 Security Ln
- 1900 Devoe Ct
- 4019 Security Ln
- 4041 Security Ln
- 1901 Devoe Ct
- 4022 Security Ln
- 4017 Security Ln
- 4024 Security Ln
- 4028 Federal Hill Rd
- 4020 Security Ln
- 4018 Security Ln
- 4015 Security Ln
- 4032 Federal Hill Rd