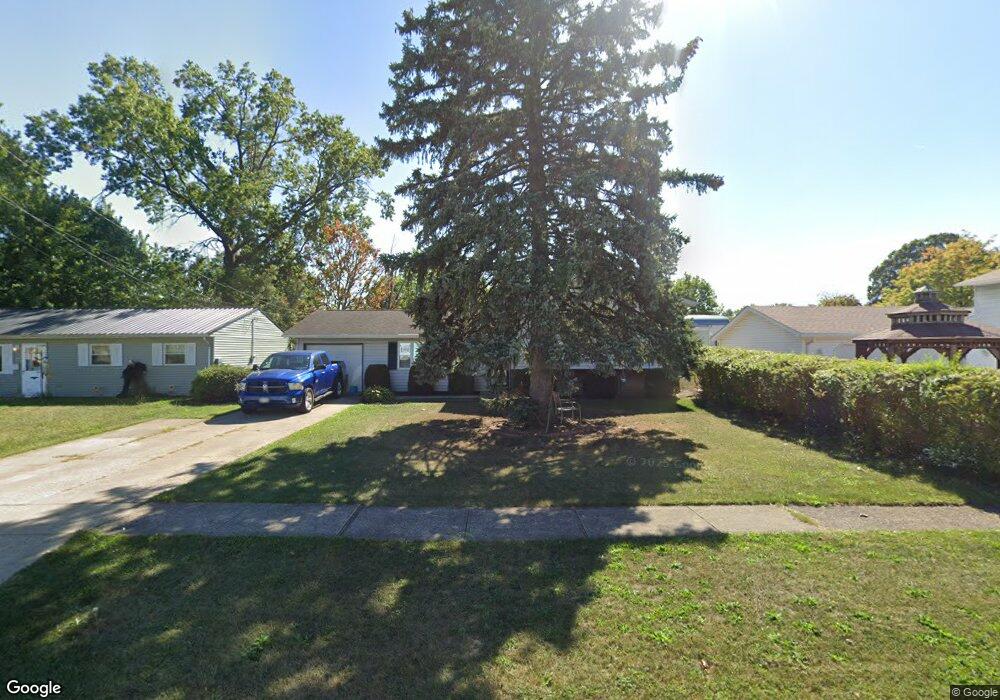
1906 E 39th St Lorain, OH 44055
Estimated Value: $131,000 - $184,000
3
Beds
1
Bath
926
Sq Ft
$172/Sq Ft
Est. Value
About This Home
This home is located at 1906 E 39th St, Lorain, OH 44055 and is currently estimated at $159,535, approximately $172 per square foot. 1906 E 39th St is a home located in Lorain County with nearby schools including Helen Steiner Rice Elementary School, Southview Middle School, and Lorain High School.
Ownership History
Date
Name
Owned For
Owner Type
Purchase Details
Closed on
Apr 22, 2008
Sold by
Hud
Bought by
Marrero Norberto
Current Estimated Value
Home Financials for this Owner
Home Financials are based on the most recent Mortgage that was taken out on this home.
Original Mortgage
$58,768
Outstanding Balance
$37,052
Interest Rate
5.88%
Mortgage Type
FHA
Estimated Equity
$122,483
Purchase Details
Closed on
Oct 2, 2007
Sold by
Bonilla Luis
Bought by
Hud
Purchase Details
Closed on
Feb 24, 2004
Sold by
Hernandez Manuel and Hernandez Denitza
Bought by
Bonilla Luis R
Home Financials for this Owner
Home Financials are based on the most recent Mortgage that was taken out on this home.
Original Mortgage
$111,617
Interest Rate
5.74%
Mortgage Type
FHA
Purchase Details
Closed on
May 22, 2000
Sold by
Bors Eugene C and Bors Kathleen L
Bought by
Hernandez Manuel
Home Financials for this Owner
Home Financials are based on the most recent Mortgage that was taken out on this home.
Original Mortgage
$93,047
Interest Rate
8.21%
Mortgage Type
FHA
Create a Home Valuation Report for This Property
The Home Valuation Report is an in-depth analysis detailing your home's value as well as a comparison with similar homes in the area
Home Values in the Area
Average Home Value in this Area
Purchase History
| Date | Buyer | Sale Price | Title Company |
|---|---|---|---|
| Marrero Norberto | $58,000 | Lakeside Title & Escrow Agen | |
| Hud | $64,000 | None Available | |
| Bonilla Luis R | $112,500 | Truetitle Agency Inc | |
| Hernandez Manuel | $94,000 | -- |
Source: Public Records
Mortgage History
| Date | Status | Borrower | Loan Amount |
|---|---|---|---|
| Open | Marrero Norberto | $58,768 | |
| Previous Owner | Bonilla Luis R | $111,617 | |
| Previous Owner | Hernandez Manuel | $93,047 |
Source: Public Records
Tax History
| Year | Tax Paid | Tax Assessment Tax Assessment Total Assessment is a certain percentage of the fair market value that is determined by local assessors to be the total taxable value of land and additions on the property. | Land | Improvement |
|---|---|---|---|---|
| 2024 | $1,707 | $41,384 | $5,278 | $36,106 |
| 2023 | $1,623 | $31,518 | $5,873 | $25,645 |
| 2022 | $1,609 | $31,518 | $5,873 | $25,645 |
| 2021 | $1,609 | $31,518 | $5,873 | $25,645 |
| 2020 | $1,492 | $25,380 | $4,730 | $20,650 |
| 2019 | $1,483 | $25,380 | $4,730 | $20,650 |
| 2018 | $1,400 | $25,380 | $4,730 | $20,650 |
| 2017 | $1,316 | $21,220 | $5,610 | $15,610 |
| 2016 | $1,305 | $21,220 | $5,610 | $15,610 |
| 2015 | $1,231 | $21,220 | $5,610 | $15,610 |
| 2014 | $1,176 | $20,310 | $5,370 | $14,940 |
| 2013 | $1,167 | $20,310 | $5,370 | $14,940 |
Source: Public Records
Map
Nearby Homes
- 1886 Homewood Dr
- 1951 E 39th St
- 1863 E 37th St
- V/L Clinton Ave
- V/L Pearl Ave
- 1809 E 34th St
- 2108 E 41st St
- 2119 E 41st St
- 1829 E 33rd St
- 1794 E 33rd St
- 1743 E 36th St
- 4095 Laurel Rd
- 1685 E 36th St
- 2066 E 30th St
- 3934 Gary Ave
- V/L Grove Ave
- 2217 E 32nd St
- 1711 E 30th St
- 0 Pearl Ave Unit 5112836
- 4137 Dunton Rd
- 1910 E 39th St
- 3913 Seneca Ave
- 1914 E 39th St
- 1907 E 40th St
- 3917 Seneca Ave
- 1911 E 40th St
- 1915 E 40th St
- 1918 E 39th St
- 3921 Seneca Ave
- 3829 Seneca Ave
- 1907 E 39th St
- 1911 E 39th St
- 1921 E 40th St
- 1915 E 39th St
- 1924 E 39th St
- 3825 Seneca Ave
- 1921 E 39th St
- 1927 E 40th St
- 3821 Seneca Ave
- 1930 E 39th St
Your Personal Tour Guide
Ask me questions while you tour the home.