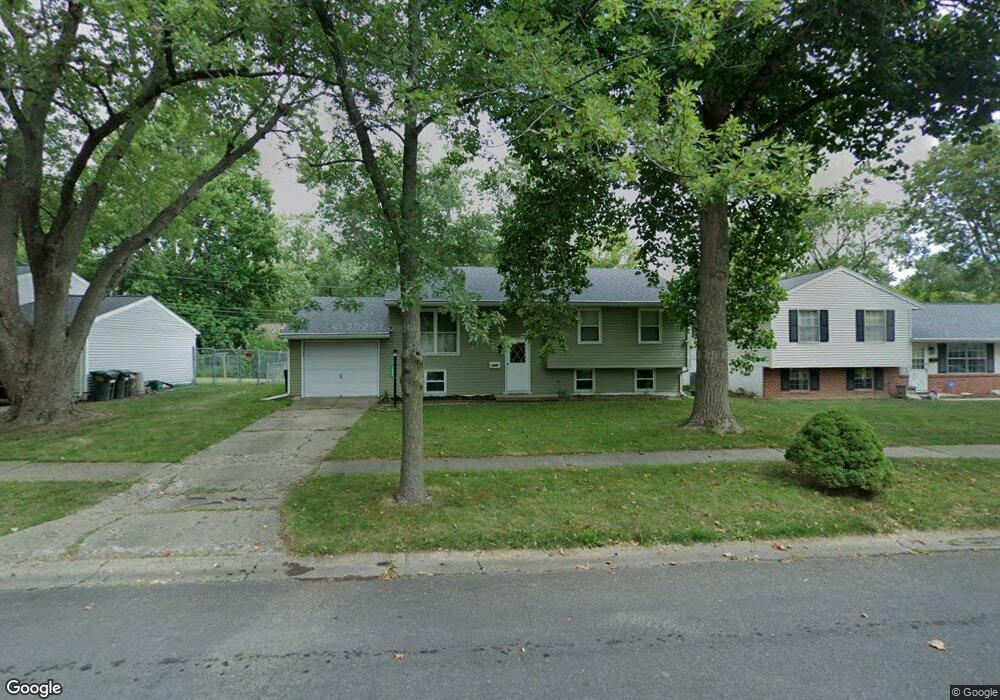
1906 E Vermont Ave Unit 1 Urbana, IL 61802
East Urbana NeighborhoodEstimated Value: $206,000 - $217,000
4
Beds
2
Baths
1,996
Sq Ft
$106/Sq Ft
Est. Value
About This Home
This home is located at 1906 E Vermont Ave Unit 1, Urbana, IL 61802 and is currently estimated at $212,245, approximately $106 per square foot. 1906 E Vermont Ave Unit 1 is a home located in Champaign County with nearby schools including Thomas Paine Elementary School, Urbana Middle School, and Urbana High School.
Ownership History
Date
Name
Owned For
Owner Type
Purchase Details
Closed on
Mar 27, 2025
Sold by
Vera Yelitza
Bought by
Quick Lindsay Ann
Current Estimated Value
Home Financials for this Owner
Home Financials are based on the most recent Mortgage that was taken out on this home.
Original Mortgage
$203,700
Outstanding Balance
$202,748
Interest Rate
6.38%
Mortgage Type
New Conventional
Estimated Equity
$9,498
Purchase Details
Closed on
Jan 16, 2023
Sold by
Dehaven Douglass
Bought by
Vera Yelitza
Home Financials for this Owner
Home Financials are based on the most recent Mortgage that was taken out on this home.
Original Mortgage
$142,864
Interest Rate
6.75%
Mortgage Type
FHA
Purchase Details
Closed on
Jun 27, 2005
Sold by
Williamson Sara J and Williamson Tod J
Bought by
Dehaven Douglass
Home Financials for this Owner
Home Financials are based on the most recent Mortgage that was taken out on this home.
Original Mortgage
$86,800
Interest Rate
6%
Mortgage Type
Fannie Mae Freddie Mac
Create a Home Valuation Report for This Property
The Home Valuation Report is an in-depth analysis detailing your home's value as well as a comparison with similar homes in the area
Home Values in the Area
Average Home Value in this Area
Purchase History
| Date | Buyer | Sale Price | Title Company |
|---|---|---|---|
| Quick Lindsay Ann | $210,000 | None Listed On Document | |
| Vera Yelitza | $145,500 | -- | |
| Dehaven Douglass | $108,500 | -- |
Source: Public Records
Mortgage History
| Date | Status | Borrower | Loan Amount |
|---|---|---|---|
| Open | Quick Lindsay Ann | $203,700 | |
| Previous Owner | Vera Yelitza | $142,864 | |
| Previous Owner | Dehaven Douglass | $86,800 |
Source: Public Records
Tax History Compared to Growth
Tax History
| Year | Tax Paid | Tax Assessment Tax Assessment Total Assessment is a certain percentage of the fair market value that is determined by local assessors to be the total taxable value of land and additions on the property. | Land | Improvement |
|---|---|---|---|---|
| 2024 | $4,593 | $53,900 | $13,240 | $40,660 |
| 2023 | $4,593 | $49,180 | $12,080 | $37,100 |
| 2022 | $4,252 | $45,280 | $11,120 | $34,160 |
| 2021 | $3,908 | $42,200 | $10,360 | $31,840 |
| 2020 | $3,512 | $38,650 | $9,490 | $29,160 |
| 2019 | $3,412 | $38,650 | $9,490 | $29,160 |
| 2018 | $3,402 | $38,930 | $9,560 | $29,370 |
| 2017 | $3,431 | $38,100 | $9,360 | $28,740 |
| 2016 | $3,624 | $40,100 | $9,850 | $30,250 |
| 2015 | $3,665 | $40,100 | $9,850 | $30,250 |
| 2014 | $3,839 | $42,210 | $10,370 | $31,840 |
| 2013 | $4,022 | $44,440 | $10,920 | $33,520 |
Source: Public Records
Map
Nearby Homes
- 1902 E Vermont Ave
- 2006 E Michigan Ave
- 2005 E Country Squire Dr
- 2105 E Pennsylvania Ave
- 1104 Lanore Dr
- 1007 Rainbow View
- 2207 E Country Squire Dr
- 903 Rainbow View
- 1505 Briarcliff Dr
- 1412 Greenridge Dr
- 1734 S Stone Creek Blvd
- 1314 S Smith Rd
- 1312 S Smith Rd
- 1316 S Smith Rd
- 1310 S Smith Rd
- 1107A Philo Rd
- 1317 Montgomery St
- 1303 Montgomery St
- 1926 S Prairie Winds Dr
- 1501 S Abercorn St
- 2002 E Vermont Ave
- 1904 E Vermont Ave
- 1905 E Michigan Ave
- 2001 E Michigan Ave
- 1903 E Michigan Ave
- 2004 E Vermont Ave
- 1404 S Curtiss Dr
- 1501 Rutledge Dr
- 2001 E Vermont Ave
- 1901 E Michigan Ave
- 1903 E Vermont Ave
- 2006 E Vermont Ave
- 2005 E Michigan Ave
- 1502 S Curtiss Dr
- 1503 Rutledge Dr
- 2003 E Vermont Ave
- 1906 E Michigan Ave
- 2008 E Vermont Ave
- 2002 E Michigan Ave
- 1504 Rutledge Dr