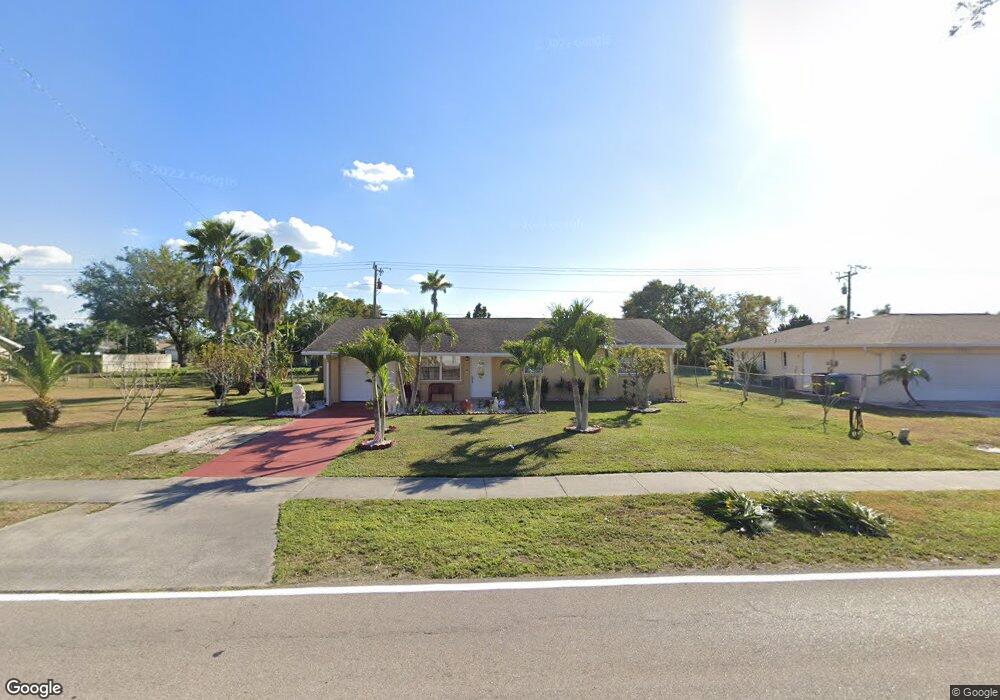
1906 Hancock Bridge Pkwy Cape Coral, FL 33990
Hancock NeighborhoodEstimated Value: $224,211 - $242,000
2
Beds
2
Baths
1,131
Sq Ft
$204/Sq Ft
Est. Value
About This Home
This home is located at 1906 Hancock Bridge Pkwy, Cape Coral, FL 33990 and is currently estimated at $231,053, approximately $204 per square foot. 1906 Hancock Bridge Pkwy is a home located in Lee County with nearby schools including Caloosa Elementary School, Tropic Isles Elementary School, and Hancock Creek Elementary School.
Ownership History
Date
Name
Owned For
Owner Type
Purchase Details
Closed on
Aug 28, 2025
Sold by
Fred Ana Ramona Altagracia
Bought by
Ana Fred Revocable Trust and Fred
Current Estimated Value
Purchase Details
Closed on
Oct 23, 2012
Sold by
Altagracia Fred Ana A and Altagracia Fred Ana Ramona
Bought by
Jerez Ricardo and Jerez Fred Ana
Purchase Details
Closed on
Apr 26, 2001
Sold by
Jerez Ricardo
Bought by
Fred Ana A
Purchase Details
Closed on
Jan 31, 1995
Sold by
Colbert Richard W and Colbert Carole Ann
Bought by
Jerez Ricardo and Jerez Jose R
Home Financials for this Owner
Home Financials are based on the most recent Mortgage that was taken out on this home.
Original Mortgage
$50,971
Interest Rate
9.21%
Mortgage Type
FHA
Create a Home Valuation Report for This Property
The Home Valuation Report is an in-depth analysis detailing your home's value as well as a comparison with similar homes in the area
Home Values in the Area
Average Home Value in this Area
Purchase History
| Date | Buyer | Sale Price | Title Company |
|---|---|---|---|
| Ana Fred Revocable Trust | $100 | None Listed On Document | |
| Fred Ana Ramona Altag | $78,000 | None Listed On Document | |
| Jerez Ricardo | $2,200 | None Available | |
| Fred Ana A | $47,900 | -- | |
| Jerez Ricardo | $51,000 | -- |
Source: Public Records
Mortgage History
| Date | Status | Borrower | Loan Amount |
|---|---|---|---|
| Previous Owner | Fred Ana A | $53,000 | |
| Previous Owner | Fred Ana A | $54,000 | |
| Previous Owner | Jerez Ricardo | $50,971 |
Source: Public Records
Tax History Compared to Growth
Tax History
| Year | Tax Paid | Tax Assessment Tax Assessment Total Assessment is a certain percentage of the fair market value that is determined by local assessors to be the total taxable value of land and additions on the property. | Land | Improvement |
|---|---|---|---|---|
| 2025 | $1,284 | $59,646 | -- | -- |
| 2024 | $1,284 | $57,965 | -- | -- |
| 2023 | $1,191 | $56,277 | $0 | $0 |
| 2022 | $1,048 | $54,638 | $0 | $0 |
| 2021 | $995 | $124,792 | $24,000 | $100,792 |
| 2020 | $989 | $52,315 | $0 | $0 |
| 2019 | $960 | $51,139 | $0 | $0 |
| 2018 | $946 | $50,185 | $0 | $0 |
| 2017 | $914 | $49,153 | $0 | $0 |
| 2016 | $872 | $85,833 | $22,000 | $63,833 |
| 2015 | $843 | $75,601 | $13,000 | $62,601 |
| 2014 | $788 | $71,100 | $9,024 | $62,076 |
| 2013 | -- | $56,699 | $7,000 | $49,699 |
Source: Public Records
Map
Nearby Homes
- 1831 SE van Loon Terrace
- 1843 Hancock Bridge Pkwy Unit 30
- 1813 Hancock Bridge Pkwy
- 1802 NE van Loon Terrace
- 2818 NE NE 1st St
- 207 SE 20th Place
- 105 NE 20th Ct
- 109 NE 20th Ct
- 2007 NE 20th Ct
- 1726 SE 2nd St
- 118 NE 21st Ave
- 1930 NE 2nd Terrace
- 2105 SE 2nd Terrace
- 236 SE 20th Ct
- 1725 SE 3rd St
- 113 NE 16th Place
- 102 NE 16th Place
- 4105 NE 21st Ave
- 503 NE 21st Ave
- 3607 NE 21st Ave
- 1902 Hancock Bridge Pkwy Unit 18
- 1912 Hancock Bridge Pkwy
- 1905 SE van Loon Terrace
- 1909 SE van Loon Terrace
- 1843 SE van Loon Terrace
- 1840 Hancock Bridge Pkwy
- 1916 Hancock Bridge Pkwy
- 1915 SE van Loon Terrace
- 1836 Hancock Bridge Pkwy
- 1911 Hancock Bridge Pkwy
- 1903 Hancock Bridge Pkwy
- 1835 SE van Loon Terrace
- 1920 Hancock Bridge Pkwy
- 1915 Hancock Bridge Pkwy
- 1908 SE van Loon Terrace
- 1919 SE van Loon Terrace Unit 18
- 1846 SE van Loon Terrace
- 1832 Hancock Bridge Pkwy
- 1842 SE van Loon Terrace
- 8 NE 19th Ct