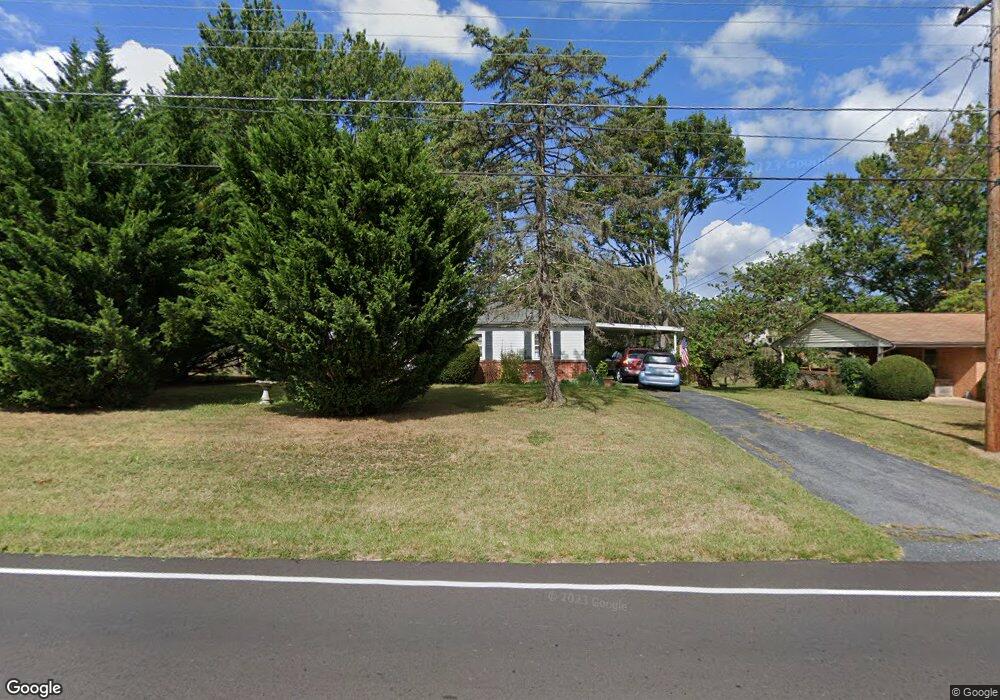
1906 Spring Hill Rd Staunton, VA 24401
Estimated Value: $300,000 - $336,000
3
Beds
2
Baths
1,768
Sq Ft
$182/Sq Ft
Est. Value
About This Home
This home is located at 1906 Spring Hill Rd, Staunton, VA 24401 and is currently estimated at $321,517, approximately $181 per square foot. 1906 Spring Hill Rd is a home located in Staunton City with nearby schools including Thomas C. McSwain Elementary School, Shelburne Middle School, and Staunton High School.
Ownership History
Date
Name
Owned For
Owner Type
Purchase Details
Closed on
Oct 4, 2019
Sold by
Nance Jerry T
Bought by
Lindsay Kenneth C
Current Estimated Value
Home Financials for this Owner
Home Financials are based on the most recent Mortgage that was taken out on this home.
Original Mortgage
$179,400
Outstanding Balance
$157,163
Interest Rate
3.5%
Mortgage Type
Credit Line Revolving
Estimated Equity
$164,354
Purchase Details
Closed on
Jun 13, 2018
Sold by
Puffenbarger Edward L
Bought by
Nance Jerry T and Nance Janet D
Purchase Details
Closed on
Feb 26, 2016
Sold by
Puffenberger Peggy Adams and Puffenbarger Peggy Adams
Bought by
Puffenbarger Edward L
Home Financials for this Owner
Home Financials are based on the most recent Mortgage that was taken out on this home.
Original Mortgage
$164,200
Interest Rate
3.92%
Mortgage Type
VA
Create a Home Valuation Report for This Property
The Home Valuation Report is an in-depth analysis detailing your home's value as well as a comparison with similar homes in the area
Home Values in the Area
Average Home Value in this Area
Purchase History
| Date | Buyer | Sale Price | Title Company |
|---|---|---|---|
| Lindsay Kenneth C | $185,000 | Blue Maple Title | |
| Nance Jerry T | $171,000 | None Available | |
| Puffenbarger Edward L | $159,000 | Lilly Title & Settlement |
Source: Public Records
Mortgage History
| Date | Status | Borrower | Loan Amount |
|---|---|---|---|
| Open | Lindsay Kenneth C | $179,400 | |
| Previous Owner | Puffenbarger Edward L | $164,200 |
Source: Public Records
Tax History Compared to Growth
Tax History
| Year | Tax Paid | Tax Assessment Tax Assessment Total Assessment is a certain percentage of the fair market value that is determined by local assessors to be the total taxable value of land and additions on the property. | Land | Improvement |
|---|---|---|---|---|
| 2025 | $2,483 | $272,900 | $50,000 | $222,900 |
| 2024 | $2,136 | $240,000 | $40,000 | $200,000 |
| 2023 | $2,136 | $240,000 | $40,000 | $200,000 |
| 2022 | $1,691 | $183,800 | $35,000 | $148,800 |
| 2021 | $1,691 | $183,800 | $35,000 | $148,800 |
| 2020 | $1,621 | $170,600 | $35,000 | $135,600 |
| 2019 | $1,621 | $170,600 | $35,000 | $135,600 |
| 2018 | $1,435 | $147,900 | $35,000 | $112,900 |
| 2017 | $1,435 | $147,900 | $35,000 | $112,900 |
| 2016 | $1,405 | $147,900 | $35,000 | $112,900 |
| 2015 | $1,405 | $147,900 | $35,000 | $112,900 |
| 2014 | $1,413 | $148,700 | $30,000 | $118,700 |
Source: Public Records
Map
Nearby Homes
- 104 Carrsbrook Dr
- 104 Woodland Dr
- 0 Spring Hill Rd
- 426 Peach St
- 4 CROWN RIDGE Berry Farm Rd
- 12 CROWN RIDGE Berry Farm Rd
- 3 CROWN RIDGE Berry Farm Rd
- 434 Peach St
- 303 Copeland Dr
- 31 Oak Ln
- 623 Bull Run
- 328 Elm St
- 1838 Vinson St
- 90 Woodlee Rd
- 77 Woodlee Rd
- 3894 Shutterlee Mill Ln
- 5 Trace Dr
- 1807 Orchard Ln
- 445 Peach St
- 112 Lee St
- 1910 Spring Hill Rd
- 1908 Spring Hill Rd
- 1912 Spring Hill Rd
- 1902 Spring Hill Rd
- 1914 Spring Hill Rd
- 1916 Spring Hill Rd
- 1900 Spring Hill Rd
- 1918 Spring Hill Rd
- 1888 Spring Hill Rd
- 1913 Spring Hill Rd
- 1922 Spring Hill Rd
- 1886 Spring Hill Rd
- 1884 Spring Hill Rd
- 1924 Spring Hill Rd
- 1882 Spring Hill Rd
- 1878 Spring Hill Rd
- 1874 Spring Hill Rd
- 1880 Spring Hill Rd
- 1930 Spring Hill Rd
- 1928 Spring Hill Rd