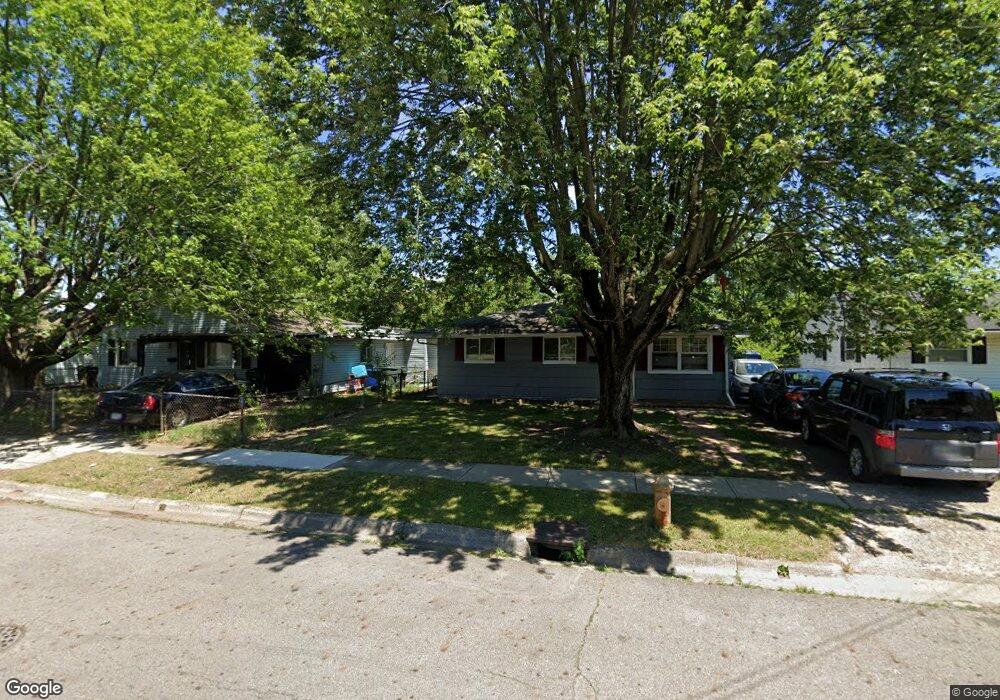
1906 Valcon Ave Columbus, OH 43207
Milbrook NeighborhoodEstimated Value: $151,000 - $162,000
3
Beds
1
Bath
952
Sq Ft
$164/Sq Ft
Est. Value
About This Home
This home is located at 1906 Valcon Ave, Columbus, OH 43207 and is currently estimated at $156,008, approximately $163 per square foot. 1906 Valcon Ave is a home located in Franklin County with nearby schools including Moler Elementary School, South High School, and Summit Academy Community School-Columbus.
Ownership History
Date
Name
Owned For
Owner Type
Purchase Details
Closed on
Aug 8, 2024
Sold by
Vb Six Llc
Bought by
Vb Ten Llc
Current Estimated Value
Home Financials for this Owner
Home Financials are based on the most recent Mortgage that was taken out on this home.
Original Mortgage
$171,567,288
Outstanding Balance
$128,690,248
Interest Rate
6.78%
Mortgage Type
Credit Line Revolving
Estimated Equity
-$128,534,240
Purchase Details
Closed on
Nov 7, 2022
Sold by
Vb One Llc
Bought by
Vb Six Llc
Purchase Details
Closed on
Aug 8, 2022
Sold by
Harrison Christopher S and Harrison Melanie K
Bought by
Vb One Llc
Purchase Details
Closed on
Jun 24, 2005
Sold by
Hoskins Gerald B
Bought by
Harrison Christopher S and Harrison Melanie K
Purchase Details
Closed on
Jul 24, 1990
Bought by
Hoskins Gerald B
Purchase Details
Closed on
Oct 1, 1984
Create a Home Valuation Report for This Property
The Home Valuation Report is an in-depth analysis detailing your home's value as well as a comparison with similar homes in the area
Home Values in the Area
Average Home Value in this Area
Purchase History
| Date | Buyer | Sale Price | Title Company |
|---|---|---|---|
| Vb Ten Llc | $1,054,000 | Os National | |
| Vb Ten Llc | $1,054,000 | Os National | |
| Vb Six Llc | -- | Total Title Services | |
| Vb One Llc | $131,000 | Total Title Services | |
| Harrison Christopher S | $48,000 | Amerititle | |
| Hoskins Gerald B | $33,000 | -- | |
| -- | $29,000 | -- |
Source: Public Records
Mortgage History
| Date | Status | Borrower | Loan Amount |
|---|---|---|---|
| Open | Vb Ten Llc | $171,567,288 | |
| Closed | Vb Ten Llc | $171,567,288 |
Source: Public Records
Tax History
| Year | Tax Paid | Tax Assessment Tax Assessment Total Assessment is a certain percentage of the fair market value that is determined by local assessors to be the total taxable value of land and additions on the property. | Land | Improvement |
|---|---|---|---|---|
| 2025 | $1,956 | $42,670 | $12,600 | $30,070 |
| 2024 | $1,956 | $42,670 | $12,600 | $30,070 |
| 2023 | $1,931 | $42,670 | $12,600 | $30,070 |
| 2022 | $737 | $13,860 | $4,830 | $9,030 |
| 2021 | $738 | $13,860 | $4,830 | $9,030 |
| 2020 | $739 | $13,860 | $4,830 | $9,030 |
| 2019 | $740 | $11,900 | $4,200 | $7,700 |
| 2018 | $1,014 | $11,900 | $4,200 | $7,700 |
| 2017 | $740 | $11,900 | $4,200 | $7,700 |
| 2016 | $1,089 | $15,230 | $4,130 | $11,100 |
| 2015 | $1,289 | $15,230 | $4,130 | $11,100 |
| 2014 | $944 | $15,230 | $4,130 | $11,100 |
| 2013 | $490 | $16,030 | $4,340 | $11,690 |
Source: Public Records
Map
Nearby Homes
- 1595 Valcon Place
- 1564 Smith Rd Unit 566
- 1834 Pannell Ave
- 1673 Liscomb Rd
- 1283 E Innis Ave
- 1718 Weiler Ave
- 1172 E Woodrow Ave
- 1330 Frebis Ave
- 1428 Geers Place
- 1418-1422 Miller Ave
- 1739 Linwood Ave
- 1019 Lawrence Dr
- 1465 Lockbourne Rd
- 1398 Lockbourne Rd
- 990 Reeb Ave
- 1366 Lockbourne Rd
- 1350 Lockbourne Rd
- 1514-1518 Wilson Ave
- 1299 Yolanda Dr
- 941 Lawrence Dr Unit 943
- 1914 Valcon Ave
- 1900 Valcon Ave
- 1920 Valcon Ave
- 1892 Valcon Ave
- 1911 Pannell Ave
- 1905 Pannell Ave
- 1917 Pannell Ave
- 1899 Pannell Ave
- 1925 Pannell Ave
- 1625 Valcon Place
- 1884 Valcon Ave
- 1620 Valcon Place
- 1638 Smith Rd Unit 640
- 1638 Smith Rd Unit 1640
- 1646 Smith Rd Unit 648
- 1893 Pannell Ave
- 1652 Smith Rd Unit 654
- 1617 Valcon Place
- 1887 Valcon Ave
- 1885 Pannell Ave
Your Personal Tour Guide
Ask me questions while you tour the home.