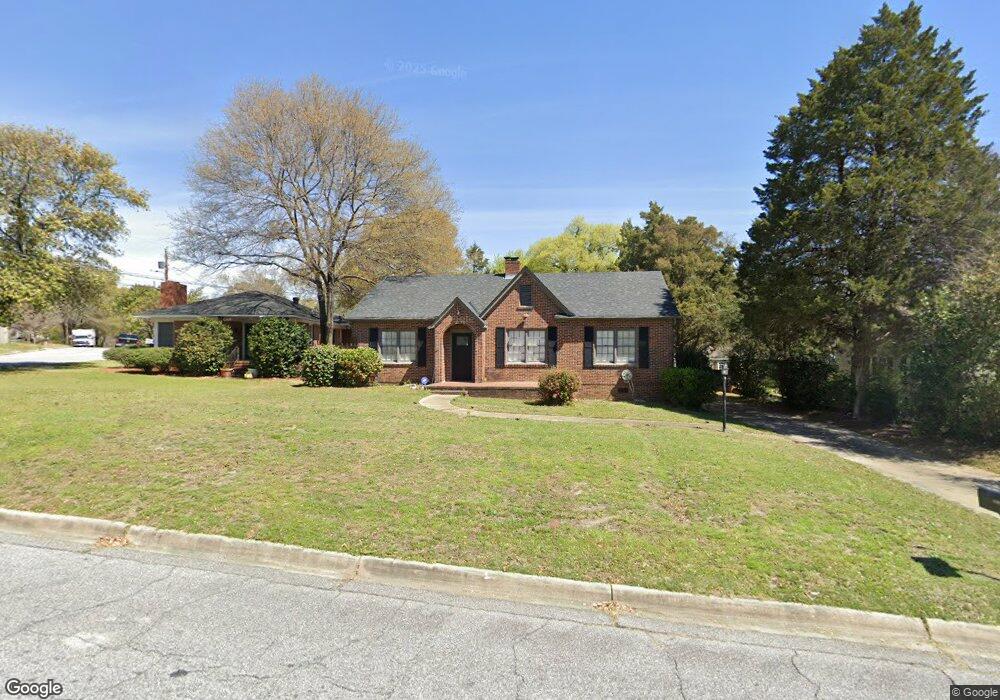
1907 35th St Columbus, GA 31904
North Columbus NeighborhoodEstimated Value: $156,000 - $211,000
3
Beds
3
Baths
1,408
Sq Ft
$124/Sq Ft
Est. Value
About This Home
This home is located at 1907 35th St, Columbus, GA 31904 and is currently estimated at $175,217, approximately $124 per square foot. 1907 35th St is a home located in Muscogee County with nearby schools including Johnson Elementary School, Richards Middle School, and Jordan Vocational High School.
Ownership History
Date
Name
Owned For
Owner Type
Purchase Details
Closed on
Apr 3, 2019
Sold by
Mirror Renovations Llc
Bought by
Talbott Sally A
Current Estimated Value
Home Financials for this Owner
Home Financials are based on the most recent Mortgage that was taken out on this home.
Original Mortgage
$149,785
Outstanding Balance
$131,953
Interest Rate
4.4%
Estimated Equity
$43,264
Purchase Details
Closed on
Nov 15, 2018
Sold by
Wells Fargo Bank Na
Bought by
Mirror Renovations Llc
Purchase Details
Closed on
Mar 6, 2018
Sold by
Mims Adrian
Bought by
Wells Fargo Bank Na
Purchase Details
Closed on
Sep 23, 2009
Sold by
Carstens Erika Lynn W and Witzke Steven Lawrence
Bought by
Mims Adrian
Home Financials for this Owner
Home Financials are based on the most recent Mortgage that was taken out on this home.
Original Mortgage
$87,505
Interest Rate
5.11%
Mortgage Type
FHA
Purchase Details
Closed on
May 29, 2007
Sold by
Witzke David M
Bought by
Witzke David M and Williams Erika Lynn W
Create a Home Valuation Report for This Property
The Home Valuation Report is an in-depth analysis detailing your home's value as well as a comparison with similar homes in the area
Home Values in the Area
Average Home Value in this Area
Purchase History
| Date | Buyer | Sale Price | Title Company |
|---|---|---|---|
| Talbott Sally A | $145,000 | -- | |
| Mirror Renovations Llc | $65,000 | -- | |
| Wells Fargo Bank Na | -- | -- | |
| Mims Adrian | $90,000 | None Available | |
| Witzke David M | -- | None Available |
Source: Public Records
Mortgage History
| Date | Status | Borrower | Loan Amount |
|---|---|---|---|
| Open | Talbott Sally A | $149,785 | |
| Previous Owner | Mims Adrian | $87,505 |
Source: Public Records
Tax History
| Year | Tax Paid | Tax Assessment Tax Assessment Total Assessment is a certain percentage of the fair market value that is determined by local assessors to be the total taxable value of land and additions on the property. | Land | Improvement |
|---|---|---|---|---|
| 2025 | $2,318 | $59,224 | $7,932 | $51,292 |
| 2024 | $2,318 | $59,224 | $7,932 | $51,292 |
| 2023 | $2,333 | $59,224 | $7,932 | $51,292 |
| 2022 | $1,785 | $43,708 | $7,932 | $35,776 |
| 2021 | $1,663 | $40,736 | $7,932 | $32,804 |
| 2020 | $1,664 | $40,736 | $7,932 | $32,804 |
| 2019 | $1,065 | $26,000 | $5,120 | $20,880 |
| 2018 | $1,149 | $40,244 | $7,932 | $32,312 |
| 2017 | $1,154 | $40,244 | $7,932 | $32,312 |
| 2016 | $1,160 | $41,389 | $3,067 | $38,322 |
| 2015 | $1,162 | $41,389 | $3,067 | $38,322 |
| 2014 | $1,164 | $41,389 | $3,067 | $38,322 |
| 2013 | -- | $41,389 | $3,067 | $38,322 |
Source: Public Records
Map
Nearby Homes
- 1801 34th St
- 3618 17th Ave
- 3640 Calvin Dr
- 1722 34th St
- 3425 17th Ave
- 3305 Cherokee Ave
- 2021 Elgin Dr
- 3905 Crestview Dr
- 3430 Woodlawn Ave
- 2257 Camille Dr
- 3316 Woodlawn Ave
- 2110 Terrace Dr
- 4001 17th Ave
- 1810 Shannon Dr
- 1705 Slade Dr
- 1616 30th St
- 3600 23rd Ave
- 1801 Saint Elmo Dr
- 2345 Gurley Dr
- 4214 17th Ave
Your Personal Tour Guide
Ask me questions while you tour the home.