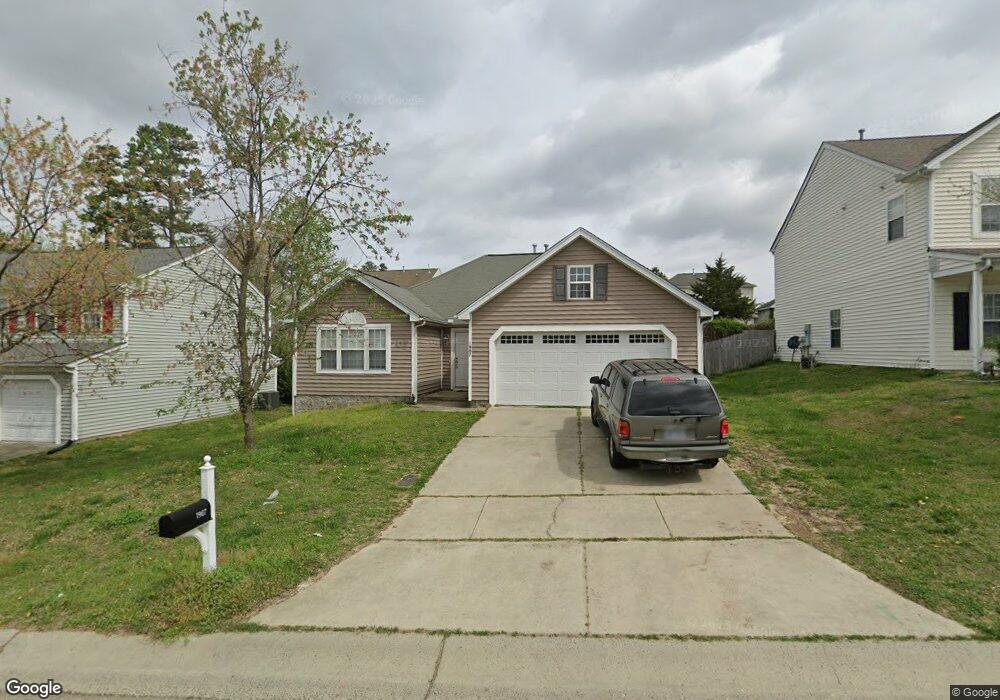
1907 Landon Farms Ln Durham, NC 27704
Northeast Durham NeighborhoodEstimated Value: $291,535 - $330,000
3
Beds
2
Baths
1,327
Sq Ft
$233/Sq Ft
Est. Value
About This Home
This home is located at 1907 Landon Farms Ln, Durham, NC 27704 and is currently estimated at $309,634, approximately $233 per square foot. 1907 Landon Farms Ln is a home located in Durham County with nearby schools including Merrick-Moore Elementary School, John W Neal Middle School, and Southern School of Energy & Sustainability.
Ownership History
Date
Name
Owned For
Owner Type
Purchase Details
Closed on
Sep 19, 2014
Sold by
American Homes 4 Rent Properties Nine Ll
Bought by
Amh 2014-2 Borrower Llc
Current Estimated Value
Home Financials for this Owner
Home Financials are based on the most recent Mortgage that was taken out on this home.
Original Mortgage
$513,315,800
Interest Rate
4.17%
Mortgage Type
Future Advance Clause Open End Mortgage
Purchase Details
Closed on
Nov 21, 2013
Sold by
Watson Ronnie and Watson Pamela D
Bought by
American Homes 4 Rent Properties Nine Ll
Purchase Details
Closed on
Aug 7, 2003
Sold by
Anderson Homes Inc
Bought by
Watson Ronnie and Watson Pamela
Home Financials for this Owner
Home Financials are based on the most recent Mortgage that was taken out on this home.
Original Mortgage
$131,560
Interest Rate
5.94%
Mortgage Type
FHA
Create a Home Valuation Report for This Property
The Home Valuation Report is an in-depth analysis detailing your home's value as well as a comparison with similar homes in the area
Home Values in the Area
Average Home Value in this Area
Purchase History
| Date | Buyer | Sale Price | Title Company |
|---|---|---|---|
| Amh 2014-2 Borrower Llc | -- | None Available | |
| American Homes 4 Rent Properties Nine Ll | $90,000 | None Available | |
| Watson Ronnie | $134,000 | -- |
Source: Public Records
Mortgage History
| Date | Status | Borrower | Loan Amount |
|---|---|---|---|
| Closed | Amh 2014-2 Borrower Llc | $513,315,800 | |
| Previous Owner | Watson Ronnie | $131,560 |
Source: Public Records
Tax History Compared to Growth
Tax History
| Year | Tax Paid | Tax Assessment Tax Assessment Total Assessment is a certain percentage of the fair market value that is determined by local assessors to be the total taxable value of land and additions on the property. | Land | Improvement |
|---|---|---|---|---|
| 2025 | $2,060 | $301,551 | $73,125 | $228,426 |
| 2024 | $2,060 | $147,649 | $23,440 | $124,209 |
| 2023 | $1,934 | $147,649 | $23,440 | $124,209 |
| 2022 | $1,890 | $147,649 | $23,440 | $124,209 |
| 2021 | $1,881 | $147,649 | $23,440 | $124,209 |
| 2020 | $1,837 | $147,649 | $23,440 | $124,209 |
| 2019 | $1,837 | $147,649 | $23,440 | $124,209 |
| 2018 | $1,684 | $124,115 | $26,370 | $97,745 |
| 2017 | $1,671 | $124,115 | $26,370 | $97,745 |
| 2016 | $1,615 | $124,115 | $26,370 | $97,745 |
| 2015 | $1,843 | $133,148 | $31,655 | $101,493 |
| 2014 | $1,843 | $133,148 | $31,655 | $101,493 |
Source: Public Records
Map
Nearby Homes
- 2121 Lime St
- 2238 Crestwood Ridge Dr
- 1012 Ringhill Bluff Dr
- 2027 Buffalo Way
- 1615 Great Bend Dr
- 1217 Junction Rd
- 18 Syracuse Place
- 1515 Milan St
- 2206 E Club Blvd
- 1509 Logan St
- 1519 Milan St
- 1823 E Geer St
- 1821 E Geer St
- 2321 Overland Dr
- 5 Sue Ann Ct
- 2013 Rabbitbrush St
- 2210 Rabbitbrush St
- 2212 Rabbitbrush St
- 2206 Rabbitbrush St
- 2214 Rabbitbrush St
- 1905 Landon Farms Ln
- 1909 Landon Farms Ln
- 5 Smoky River Ct
- 1903 Landon Farms Ln
- 7 Smoky River Ct
- 1911 Landon Farms Ln
- 3 Smoky River Ct
- 1910 Landon Farms Ln
- 1912 Landon Farms Ln
- 1908 Landon Farms Ln
- 1 Smoky River Ct
- 9 Smoky River Ct
- 1906 Landon Farms Ln
- 1914 Landon Farms Ln
- 1901 Landon Farms Ln
- 0 Smoky River Ct
- 1904 Landon Farms Ln
- 11 Smoky River Ct
- 2019 Great Bend Dr
- 2021 Great Bend Dr