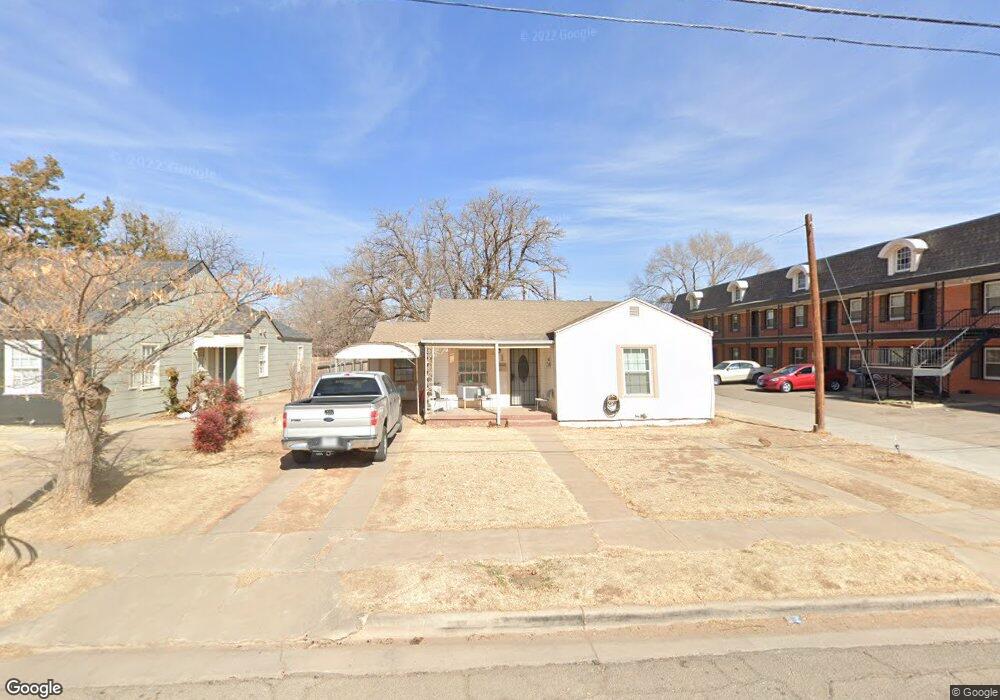
1908 21st St Lubbock, TX 79411
Heart of Lubbock NeighborhoodEstimated Value: $130,000 - $140,000
3
Beds
2
Baths
1,262
Sq Ft
$107/Sq Ft
Est. Value
About This Home
This home is located at 1908 21st St, Lubbock, TX 79411 and is currently estimated at $134,775, approximately $106 per square foot. 1908 21st St is a home located in Lubbock County with nearby schools including Dupre Elementary School, Brown Elementary School, and Slaton Middle School.
Ownership History
Date
Name
Owned For
Owner Type
Purchase Details
Closed on
May 1, 2006
Sold by
Biddy William M
Bought by
Mora Elias M and Mora Francisco M
Current Estimated Value
Purchase Details
Closed on
Nov 10, 2005
Sold by
Azua Aurora G
Bought by
Biddy William M
Purchase Details
Closed on
May 16, 1988
Bought by
Mora Elias M and Mora Francisca M
Create a Home Valuation Report for This Property
The Home Valuation Report is an in-depth analysis detailing your home's value as well as a comparison with similar homes in the area
Home Values in the Area
Average Home Value in this Area
Purchase History
| Date | Buyer | Sale Price | Title Company |
|---|---|---|---|
| Mora Elias M | -- | None Available | |
| Biddy William M | -- | None Available | |
| Mora Elias M | -- | -- |
Source: Public Records
Mortgage History
| Date | Status | Borrower | Loan Amount |
|---|---|---|---|
| Closed | Mora Elias M | $0 |
Source: Public Records
Tax History Compared to Growth
Tax History
| Year | Tax Paid | Tax Assessment Tax Assessment Total Assessment is a certain percentage of the fair market value that is determined by local assessors to be the total taxable value of land and additions on the property. | Land | Improvement |
|---|---|---|---|---|
| 2025 | $979 | $115,838 | $25,000 | $90,838 |
| 2024 | $19 | $134,671 | $25,000 | $109,671 |
| 2023 | $884 | $94,504 | $13,650 | $96,377 |
| 2022 | $1,739 | $85,913 | $13,650 | $89,177 |
| 2021 | $1,673 | $78,103 | $13,650 | $64,453 |
| 2020 | $1,651 | $75,943 | $13,650 | $62,293 |
| 2019 | $1,550 | $69,039 | $13,650 | $55,389 |
| 2018 | $1,562 | $69,493 | $13,650 | $55,843 |
| 2017 | $1,422 | $63,175 | $2,750 | $60,425 |
| 2016 | $1,354 | $60,153 | $2,750 | $57,403 |
| 2015 | $1,049 | $58,677 | $2,750 | $55,927 |
| 2014 | $1,049 | $55,504 | $2,750 | $52,754 |
Source: Public Records
Map
Nearby Homes