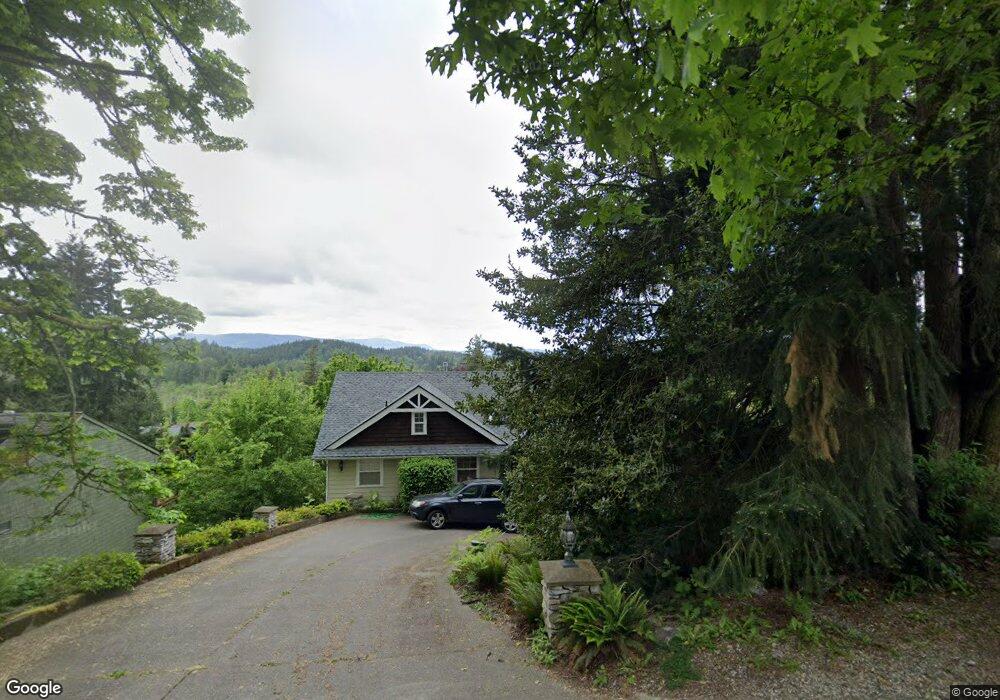
1908 36th St Bellingham, WA 98229
Samish NeighborhoodEstimated Value: $935,000 - $1,181,000
4
Beds
3
Baths
1,186
Sq Ft
$874/Sq Ft
Est. Value
About This Home
This home is located at 1908 36th St, Bellingham, WA 98229 and is currently estimated at $1,036,871, approximately $874 per square foot. 1908 36th St is a home located in Whatcom County with nearby schools including Happy Valley Elementary School, Fairhaven Middle School, and Sehome High School.
Ownership History
Date
Name
Owned For
Owner Type
Purchase Details
Closed on
Aug 29, 2016
Sold by
Callaghan Thomas M
Bought by
Callaghan Thomas Mactavish and Takano Kaoru
Current Estimated Value
Purchase Details
Closed on
Aug 12, 2005
Sold by
Lively Clinton J and Lively Eryn C
Bought by
Callaghan Thomas M
Home Financials for this Owner
Home Financials are based on the most recent Mortgage that was taken out on this home.
Original Mortgage
$359,650
Outstanding Balance
$187,713
Interest Rate
5.56%
Mortgage Type
Fannie Mae Freddie Mac
Estimated Equity
$849,158
Purchase Details
Closed on
Jun 5, 2000
Sold by
Berry Richard K D
Bought by
Lively Clinton J and Lively Eryn C
Home Financials for this Owner
Home Financials are based on the most recent Mortgage that was taken out on this home.
Original Mortgage
$213,000
Interest Rate
8.15%
Purchase Details
Closed on
Aug 16, 1999
Sold by
Eriksen Vagn and Buckland Jennifer
Bought by
Berry Richard K D
Home Financials for this Owner
Home Financials are based on the most recent Mortgage that was taken out on this home.
Original Mortgage
$136,000
Interest Rate
7.63%
Create a Home Valuation Report for This Property
The Home Valuation Report is an in-depth analysis detailing your home's value as well as a comparison with similar homes in the area
Home Values in the Area
Average Home Value in this Area
Purchase History
| Date | Buyer | Sale Price | Title Company |
|---|---|---|---|
| Callaghan Thomas Mactavish | -- | None Available | |
| Callaghan Thomas M | $450,212 | Whatcom Land Title | |
| Lively Clinton J | $224,500 | Chicago Title Insurance | |
| Berry Richard K D | $53,500 | Island Title |
Source: Public Records
Mortgage History
| Date | Status | Borrower | Loan Amount |
|---|---|---|---|
| Open | Callaghan Thomas M | $359,650 | |
| Previous Owner | Lively Clinton J | $213,000 | |
| Previous Owner | Berry Richard K D | $136,000 |
Source: Public Records
Tax History Compared to Growth
Tax History
| Year | Tax Paid | Tax Assessment Tax Assessment Total Assessment is a certain percentage of the fair market value that is determined by local assessors to be the total taxable value of land and additions on the property. | Land | Improvement |
|---|---|---|---|---|
| 2024 | $7,318 | $908,086 | $405,456 | $502,630 |
| 2023 | $7,318 | $940,552 | $419,952 | $520,600 |
| 2022 | $5,996 | $800,475 | $357,408 | $443,067 |
| 2021 | $5,573 | $645,562 | $288,240 | $357,322 |
| 2020 | $5,473 | $566,277 | $252,840 | $313,437 |
| 2019 | $4,789 | $537,520 | $240,000 | $297,520 |
| 2018 | $4,972 | $471,571 | $190,418 | $281,153 |
| 2017 | $4,381 | $418,585 | $169,020 | $249,565 |
| 2016 | $3,991 | $385,465 | $155,520 | $229,945 |
| 2015 | $3,928 | $365,593 | $147,420 | $218,173 |
| 2014 | -- | $348,175 | $140,400 | $207,775 |
| 2013 | -- | $331,199 | $135,000 | $196,199 |
Source: Public Records
Map
Nearby Homes
- 1615 Samish Way
- 1800 40th Place
- 3104 Wilson Ave
- 3605 Mill Ave
- 4203 Harrison St
- 2500 Samish Way Unit 50
- 2500 Samish Way Unit 13
- 2010 Samish Crest Way
- 2815 Willis St
- 2604 S 42nd St
- 2608 S 42nd St
- 2694 Donovan Ave Unit 32
- 2600 42nd
- 1000 Samish Way
- 2015 24th St Unit 31
- 835 Samish Way
- 2400 Donovan Ave Unit 13
- 2100 Lindsay Ave
- 921 Whitewater Dr
- 3204 30th St