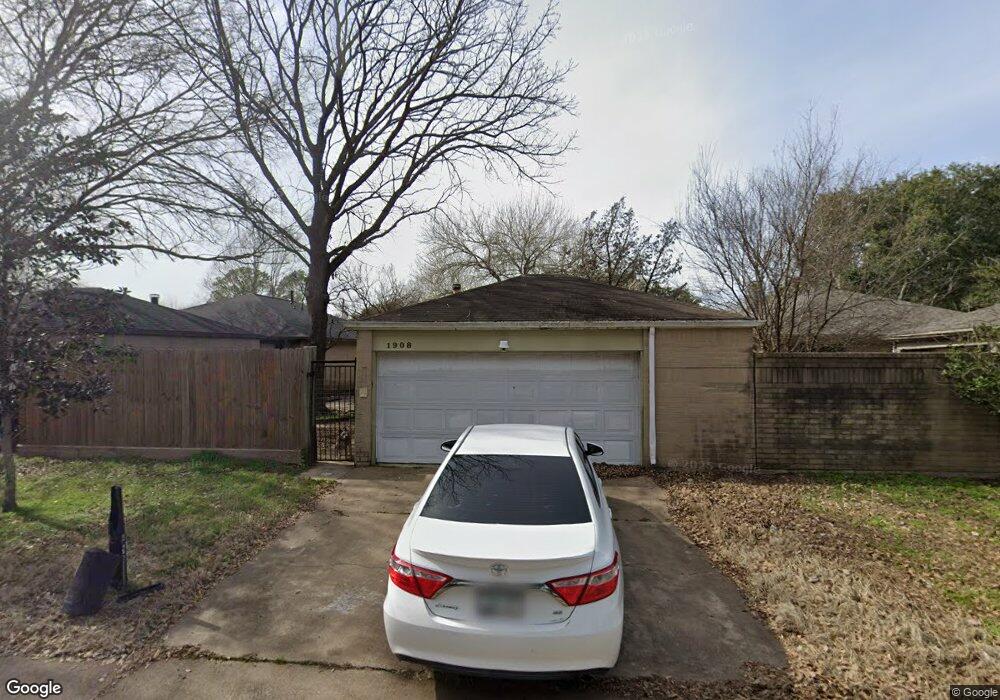
1908 Chelsea Ct Rosenberg, TX 77471
Estimated Value: $202,000 - $244,000
3
Beds
2
Baths
1,392
Sq Ft
$158/Sq Ft
Est. Value
About This Home
This home is located at 1908 Chelsea Ct, Rosenberg, TX 77471 and is currently estimated at $219,724, approximately $157 per square foot. 1908 Chelsea Ct is a home located in Fort Bend County with nearby schools including Taylor Ray Elementary School, Navarro Middle School, and George Junior High School.
Ownership History
Date
Name
Owned For
Owner Type
Purchase Details
Closed on
Nov 22, 2022
Sold by
Zinser Jeanette and Eaves Christine
Bought by
Seidel Carren M
Current Estimated Value
Home Financials for this Owner
Home Financials are based on the most recent Mortgage that was taken out on this home.
Original Mortgage
$150,000
Outstanding Balance
$145,310
Interest Rate
7.08%
Mortgage Type
New Conventional
Estimated Equity
$74,414
Purchase Details
Closed on
Sep 2, 2022
Sold by
Zinser Jeannette
Bought by
Seidel Carren
Purchase Details
Closed on
Jan 29, 2013
Sold by
Fannie Mae
Bought by
Solanic Ronald
Purchase Details
Closed on
Dec 4, 2012
Sold by
Poteet Marjorie R
Bought by
Federal National Mortgage Association and Fannie Mae
Purchase Details
Closed on
Jun 25, 2010
Sold by
Poteet Marjorie A
Bought by
Solanic Ronald
Create a Home Valuation Report for This Property
The Home Valuation Report is an in-depth analysis detailing your home's value as well as a comparison with similar homes in the area
Home Values in the Area
Average Home Value in this Area
Purchase History
| Date | Buyer | Sale Price | Title Company |
|---|---|---|---|
| Seidel Carren M | -- | Frontier Title Company | |
| Seidel Carren | -- | -- | |
| Solanic Ronald | -- | Stewart Title | |
| Federal National Mortgage Association | $92,046 | None Available | |
| Solanic Ronald | -- | -- | |
| Solanic Ronald | -- | -- |
Source: Public Records
Mortgage History
| Date | Status | Borrower | Loan Amount |
|---|---|---|---|
| Open | Seidel Carren M | $150,000 |
Source: Public Records
Tax History Compared to Growth
Tax History
| Year | Tax Paid | Tax Assessment Tax Assessment Total Assessment is a certain percentage of the fair market value that is determined by local assessors to be the total taxable value of land and additions on the property. | Land | Improvement |
|---|---|---|---|---|
| 2025 | $3,440 | $168,788 | $28,600 | $140,188 |
| 2024 | $3,440 | $182,125 | $28,600 | $153,525 |
| 2023 | $3,440 | $198,644 | $22,000 | $176,644 |
| 2022 | $1,039 | $146,880 | $6,340 | $140,540 |
| 2021 | $2,770 | $133,530 | $22,000 | $111,530 |
| 2020 | $2,729 | $128,570 | $22,000 | $106,570 |
| 2019 | $2,670 | $116,880 | $22,000 | $94,880 |
| 2018 | $2,466 | $106,250 | $22,000 | $84,250 |
| 2017 | $2,254 | $96,590 | $18,000 | $78,590 |
| 2016 | $2,175 | $93,180 | $18,000 | $75,180 |
| 2015 | $1,096 | $93,920 | $18,000 | $75,920 |
| 2014 | $2,081 | $87,610 | $18,000 | $69,610 |
Source: Public Records
Map
Nearby Homes
- 1517 4th St
- 2717 Parrott Ave
- 2500 Parkway Ave
- 1410 8th St
- 1030 4th St
- 1401 5th St
- 2513 3rd St
- 2002 Austin St
- 1004 Houston St
- 2409 Avenue K
- 0 Southgate Dr
- 1314 2nd St
- 1314 1st St
- 1212 Alamo St
- 2217 Bernie Ave
- 1613 Mulcahy St
- 2606 Wastelbread Ln
- 2523 Good Morrow Dr
- 2527 Good Morrow Dr
- 2622 Good Morrow Dr
- 1912 Chelsea Ct
- 1904 Chelsea Ct
- 1900 Chelsea Ct
- 1916 Chelsea Ct
- 1920 Chelsea Ct
- 1909 Chelsea Ct
- 1905 Chelsea Ct
- 1913 Chelsea Ct
- 1901 Chelsea Ct
- 1924 Chelsea Ct
- 0 Chelsea Ct
- 1746 7th St
- 1737 6th St
- 1908 Tremont Ct
- 1740 7th St
- 2000 Chelsea Ct
- 1904 Tremont Ct
- 1912 Tremont Ct
- 2004 Chelsea Ct
- 1900 Tremont Ct