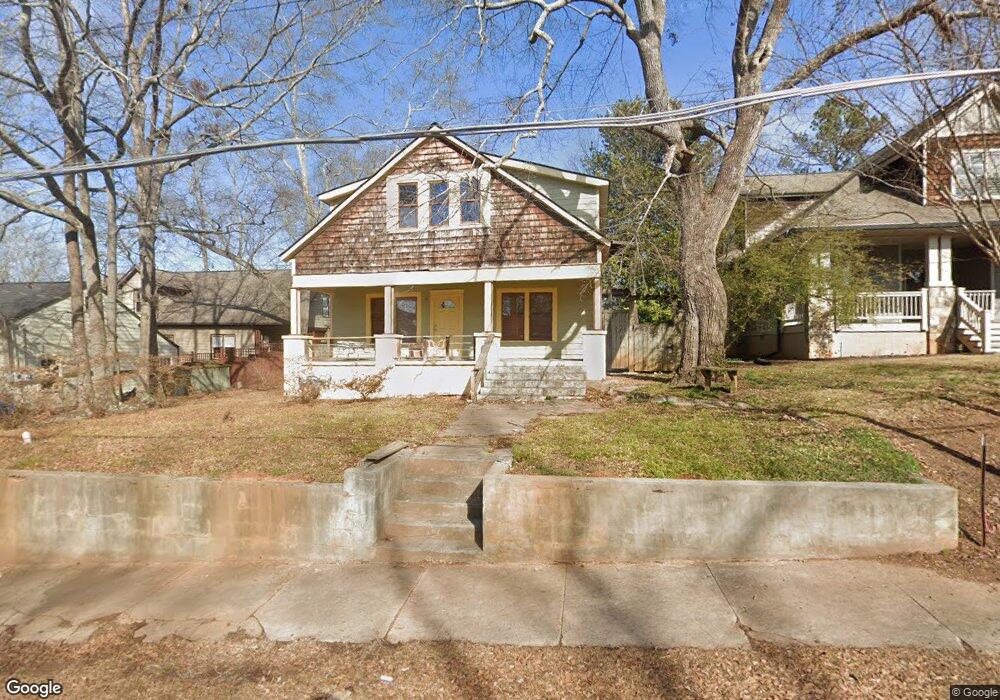
1908 Delano Dr NE Atlanta, GA 30317
Kirkwood NeighborhoodEstimated Value: $636,000 - $857,000
3
Beds
3
Baths
2,361
Sq Ft
$309/Sq Ft
Est. Value
About This Home
This home is located at 1908 Delano Dr NE, Atlanta, GA 30317 and is currently estimated at $729,166, approximately $308 per square foot. 1908 Delano Dr NE is a home located in DeKalb County with nearby schools including Toomer Elementary School, King Middle School, and Maynard Holbrook Jackson High School.
Ownership History
Date
Name
Owned For
Owner Type
Purchase Details
Closed on
Mar 10, 2009
Sold by
Federal Natl Mtg Assn Fnma
Bought by
Crosby James and Crosby Diana
Current Estimated Value
Home Financials for this Owner
Home Financials are based on the most recent Mortgage that was taken out on this home.
Original Mortgage
$169,277
Outstanding Balance
$107,751
Interest Rate
5.15%
Mortgage Type
FHA
Estimated Equity
$621,415
Purchase Details
Closed on
Apr 1, 2008
Sold by
Washington Mutual Bank
Bought by
Federal National Mortgage Association
Purchase Details
Closed on
Aug 15, 1996
Sold by
1St National Bank Chicago
Bought by
Jacobs Bert
Purchase Details
Closed on
Dec 5, 1995
Sold by
Williams Renee J
Bought by
1St Nat L Bk Chicago
Purchase Details
Closed on
Mar 1, 1994
Sold by
Jackson Raymond A
Bought by
Fleet Finance
Create a Home Valuation Report for This Property
The Home Valuation Report is an in-depth analysis detailing your home's value as well as a comparison with similar homes in the area
Home Values in the Area
Average Home Value in this Area
Purchase History
| Date | Buyer | Sale Price | Title Company |
|---|---|---|---|
| Crosby James | -- | -- | |
| Federal National Mortgage Association | -- | -- | |
| Washington Mutual Bank | $207,751 | -- | |
| Jacobs Bert | $29,900 | -- | |
| 1St Nat L Bk Chicago | $27,200 | -- | |
| Fleet Finance | $40,600 | -- |
Source: Public Records
Mortgage History
| Date | Status | Borrower | Loan Amount |
|---|---|---|---|
| Open | Crosby James | $169,277 |
Source: Public Records
Tax History Compared to Growth
Tax History
| Year | Tax Paid | Tax Assessment Tax Assessment Total Assessment is a certain percentage of the fair market value that is determined by local assessors to be the total taxable value of land and additions on the property. | Land | Improvement |
|---|---|---|---|---|
| 2024 | $2,631 | $263,040 | $64,040 | $199,000 |
| 2023 | $2,631 | $279,200 | $64,040 | $215,160 |
| 2022 | $2,009 | $212,320 | $50,600 | $161,720 |
| 2021 | $1,888 | $199,480 | $50,600 | $148,880 |
| 2020 | $1,780 | $171,760 | $50,600 | $121,160 |
| 2019 | $1,898 | $184,000 | $50,600 | $133,400 |
| 2018 | $1,566 | $170,560 | $50,600 | $119,960 |
| 2017 | $1,513 | $153,440 | $25,640 | $127,800 |
| 2016 | $1,311 | $131,320 | $25,640 | $105,680 |
| 2014 | $780 | $85,480 | $25,600 | $59,880 |
Source: Public Records
Map
Nearby Homes
- 210 Locust St NE
- 138 Kirkwood Rd NE Unit 20
- 1912 Hosea L Williams Dr NE Unit 5
- 72 Rogers St NE
- 61 Clay St NE
- 262 Southerland Terrace NE
- 112 Rogers St NE Unit 409
- 112 Rogers St NE Unit 305
- 112 Rogers St NE Unit 204
- 112 Rogers St NE Unit 506
- 112 Rogers St NE Unit 207
- 112 Rogers St NE Unit 206
- 1970 Dekalb Ave NE Unit 2
- 194 Rockyford Rd NE
- 23 Clay St NE
- 2018 Presley Way NE
- 195 Arizona Ave NE Unit 110
- 195 Arizona Ave NE Unit 197
- 1914 Delano Dr NE
- 121 Warren St NE
- 1902 Delano Dr NE
- 1920 Delano Dr NE
- 1909 Delano Dr NE
- 103 Warren St NE Unit 18
- 103 Warren St NE
- 1909 Trotti St NE
- 1905 Trotti St NE
- 1915 Trotti St NE
- 1926 Delano Dr NE
- 97 Warren St NE
- 1899 Trotti St NE
- 1919 Delano Dr NE
- 1923 Trotti St NE
- 1936 Delano Dr NE
- 1927 Delano Dr NE
- 1929 Trotti St NE
- 104 Warren St NE
- 1931 Delano Dr NE