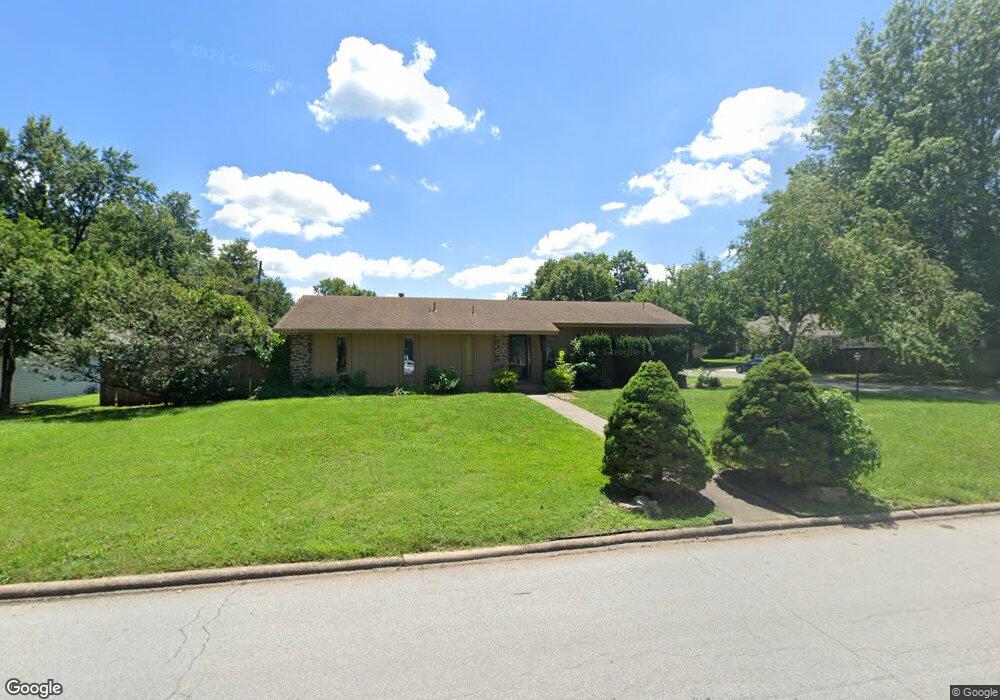
1908 E Swallow St Springfield, MO 65804
Lake Springfield NeighborhoodEstimated Value: $259,744 - $311,000
3
Beds
2
Baths
1,716
Sq Ft
$168/Sq Ft
Est. Value
About This Home
This home is located at 1908 E Swallow St, Springfield, MO 65804 and is currently estimated at $287,686, approximately $167 per square foot. 1908 E Swallow St is a home located in Greene County with nearby schools including Walt Disney Elementary School, Cherokee Middle School, and Kickapoo High School.
Ownership History
Date
Name
Owned For
Owner Type
Purchase Details
Closed on
Apr 8, 2011
Sold by
Nyander Hal R and Nyander Penny
Bought by
Inlow David and Inlow Penny
Current Estimated Value
Home Financials for this Owner
Home Financials are based on the most recent Mortgage that was taken out on this home.
Original Mortgage
$84,750
Outstanding Balance
$58,750
Interest Rate
4.98%
Mortgage Type
New Conventional
Estimated Equity
$228,936
Purchase Details
Closed on
Nov 10, 2005
Sold by
Barens Jams C
Bought by
Nyander Hal R and Nyander Jamie S
Home Financials for this Owner
Home Financials are based on the most recent Mortgage that was taken out on this home.
Original Mortgage
$137,655
Interest Rate
8.37%
Mortgage Type
Assumption
Purchase Details
Closed on
Jan 26, 2005
Sold by
Barnes James C and Risdal Barnes Michele
Bought by
Barnes James C and Risdal Barnes Michele M
Create a Home Valuation Report for This Property
The Home Valuation Report is an in-depth analysis detailing your home's value as well as a comparison with similar homes in the area
Home Values in the Area
Average Home Value in this Area
Purchase History
| Date | Buyer | Sale Price | Title Company |
|---|---|---|---|
| Inlow David | -- | None Available | |
| Nyander Hal R | -- | None Available | |
| Barnes James C | -- | None Available |
Source: Public Records
Mortgage History
| Date | Status | Borrower | Loan Amount |
|---|---|---|---|
| Open | Inlow David | $84,750 | |
| Previous Owner | Nyander Hal R | $137,655 |
Source: Public Records
Tax History
| Year | Tax Paid | Tax Assessment Tax Assessment Total Assessment is a certain percentage of the fair market value that is determined by local assessors to be the total taxable value of land and additions on the property. | Land | Improvement |
|---|---|---|---|---|
| 2025 | $1,608 | $32,280 | $11,400 | $20,880 |
| 2024 | $1,398 | $26,050 | $7,220 | $18,830 |
| 2023 | $1,390 | $26,050 | $7,220 | $18,830 |
| 2022 | $1,319 | $24,150 | $7,220 | $16,930 |
| 2021 | $1,319 | $24,150 | $7,220 | $16,930 |
| 2020 | $1,379 | $24,150 | $7,220 | $16,930 |
| 2019 | $1,340 | $24,150 | $7,220 | $16,930 |
| 2018 | $1,135 | $20,460 | $7,220 | $13,240 |
| 2017 | $1,123 | $20,120 | $7,220 | $12,900 |
| 2016 | $1,103 | $20,120 | $7,220 | $12,900 |
| 2015 | $1,093 | $20,120 | $7,220 | $12,900 |
| 2014 | $1,066 | $19,490 | $7,220 | $12,270 |
Source: Public Records
Map
Nearby Homes
- 1821 E Vincent Dr
- 1811 E Vincent Dr
- 4525 S Aladdin Ct
- 2207 E Cardinal St
- 2207 E Lark St
- 4006 S Kentwood Ave
- 2304 E Cardinal St
- 4706 S Connor Ave
- 2390 E Cardinal St
- 4749 S Bellhurst Ave
- 2413 E Swallow St
- 2228 E Armory Ct
- 4771 S Bellhurst Ave
- 4781 S Bellhurst Ave
- 2443 E Swallow St
- 1842 E Richmond Place
- 2437 E German Ivy
- 1369 E Price St
- 3731 S Glenstone Ave Unit A7
- 3731 S Glenstone Ave Unit 85
- 1918 E Swallow St
- 4322 S Raven Place
- 1860 E Swallow St
- 1905 E Swallow St
- 4317 S Raven Place
- 1926 E Swallow St
- 1915 E Swallow St
- 4330 S Raven Place
- 4327 S Raven Place
- 1925 E Swallow St
- 1857 E Swallow St
- 1850 E Swallow St
- 1936 E Swallow St
- 4334 S Raven Place
- 4319 S Pratt Ave
- 1916 E Lark St
- 1904 E Lark St
- 1933 E Swallow St
- 1924 E Lark St
- 1849 E Swallow St
Your Personal Tour Guide
Ask me questions while you tour the home.