Estimated Value: $257,000 - $271,000
3
Beds
2
Baths
1,351
Sq Ft
$194/Sq Ft
Est. Value
About This Home
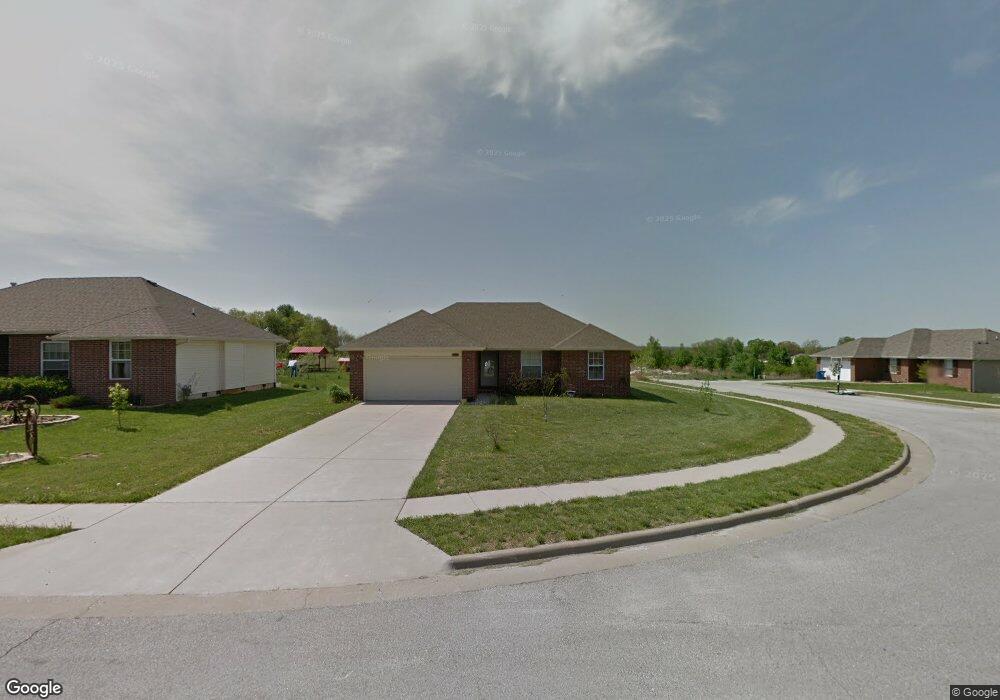
This home is located at 1908 Overland Dr, Ozark, MO 65721 and is currently estimated at $262,083, approximately $193 per square foot. 1908 Overland Dr is a home located in Christian County with nearby schools including East Elementary School, Ozark Junior High School, and Ozark Middle School.
Ownership History
Date
Name
Owned For
Owner Type
Purchase Details
Closed on
Dec 3, 2019
Sold by
Chepkondol Geoffrey and Chepkondol Daisy J
Bought by
Chepkondol Geoffrey and Chepkondol Daisy J
Current Estimated Value
Purchase Details
Closed on
Nov 13, 2017
Sold by
Robison Lillian D
Bought by
Chepkondol Geoffrey K
Home Financials for this Owner
Home Financials are based on the most recent Mortgage that was taken out on this home.
Original Mortgage
$122,735
Outstanding Balance
$101,577
Interest Rate
3.75%
Mortgage Type
FHA
Estimated Equity
$160,506
Purchase Details
Closed on
Nov 15, 2007
Sold by
Cantrells Patriot Homes Inc
Bought by
Robinson Lillian D
Home Financials for this Owner
Home Financials are based on the most recent Mortgage that was taken out on this home.
Original Mortgage
$84,236
Interest Rate
6.43%
Mortgage Type
New Conventional
Purchase Details
Closed on
Aug 23, 2007
Sold by
Lacey Bros Construction Inc
Bought by
Cantrell S Patriot Homes Inc
Create a Home Valuation Report for This Property
The Home Valuation Report is an in-depth analysis detailing your home's value as well as a comparison with similar homes in the area
Home Values in the Area
Average Home Value in this Area
Purchase History
| Date | Buyer | Sale Price | Title Company |
|---|---|---|---|
| Chepkondol Geoffrey | -- | Hogan Land Title Company | |
| Chepkondol Geoffrey K | -- | None Available | |
| Robinson Lillian D | -- | None Available | |
| Cantrell S Patriot Homes Inc | -- | None Available |
Source: Public Records
Mortgage History
| Date | Status | Borrower | Loan Amount |
|---|---|---|---|
| Open | Chepkondol Geoffrey K | $122,735 | |
| Previous Owner | Robinson Lillian D | $84,236 |
Source: Public Records
Tax History
| Year | Tax Paid | Tax Assessment Tax Assessment Total Assessment is a certain percentage of the fair market value that is determined by local assessors to be the total taxable value of land and additions on the property. | Land | Improvement |
|---|---|---|---|---|
| 2025 | $1,739 | $27,820 | -- | -- |
| 2024 | $1,742 | $25,420 | -- | -- |
| 2023 | $1,742 | $25,420 | $0 | $0 |
| 2022 | $1,692 | $24,470 | $0 | $0 |
| 2021 | $1,648 | $24,470 | $0 | $0 |
| 2020 | $1,429 | $20,880 | $0 | $0 |
| 2019 | $1,429 | $20,880 | $0 | $0 |
| 2018 | $1,432 | $20,880 | $0 | $0 |
| 2017 | $1,432 | $20,880 | $0 | $0 |
| 2016 | $1,391 | $20,430 | $0 | $0 |
| 2015 | $1,397 | $20,430 | $20,430 | $0 |
| 2014 | $1,388 | $20,410 | $0 | $0 |
| 2013 | $13 | $20,410 | $0 | $0 |
| 2011 | $13 | $39,600 | $0 | $0 |
Source: Public Records
Map
Nearby Homes
- 1901 E Overland Dr
- 1904 S Thomas Dr
- 2000 S 16th
- 2005 S 22nd Ave
- 2010 S 22nd Ave
- 1433 E Warren Ave
- 1800 S 14th Ave
- 1701 S 15th Ave
- 1300 E Bain St
- 1366 S 20th Ave
- 1509 E Hartley St
- 2400 S 15th Ave
- 000 E Hartley Rd
- 1502 E Sycamore St
- 1107 Becky Ln
- 2002 S 11th Ave
- 2601 S 15th Ave
- 2114 E Finch St
- 811 E Rainey St
- 1615 E Melanie Ln
- 1908 E Overland Dr
- 1912 E Overland Dr
- 1916 E Overland Dr
- 1916 Overland Dr
- 1813 S Prestige Dr
- 1809 S Prestige Dr
- 1903 E Costa Mesa Ct
- 1805 S Prestige Dr
- 1909 Overland Dr
- 1901 E Costa Mesa Ct
- 1905 E Overland Dr
- 1811 E Costa Mesa Ct
- 1901 Overland Dr
- 1907 E Costa Mesa Ct
- 1913 Overland Dr
- 1920 E Overland Dr
- 1801 S Prestige Dr
- 1807 E Costa Mesa Ct
- 1911 E Costa Mesa Ct
- 1924 Overland Dr