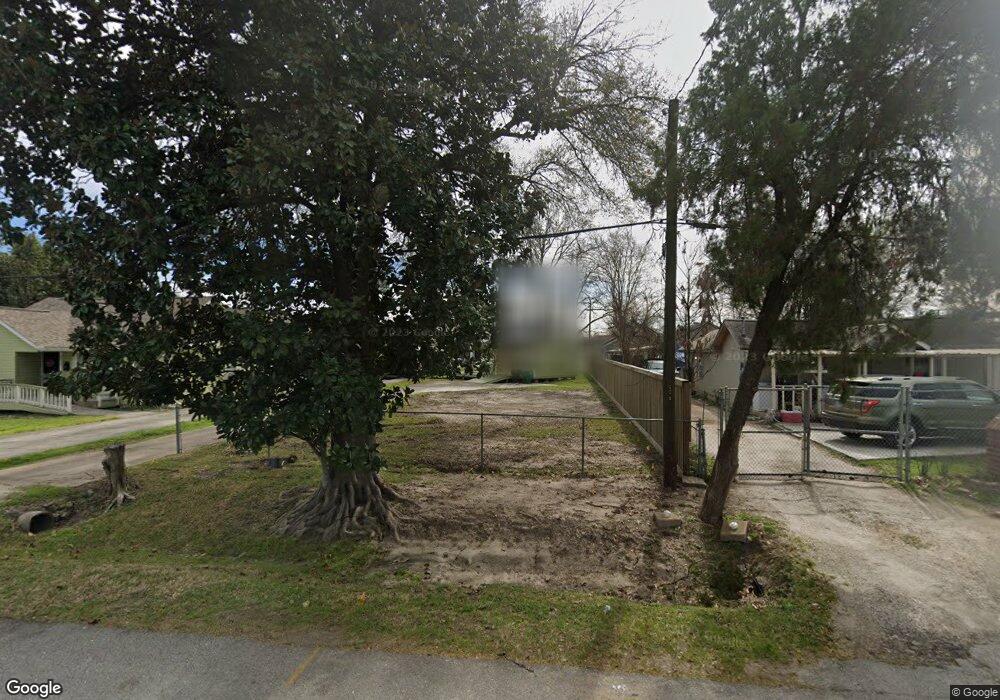
1908 Reid St Houston, TX 77026
Eastex-Jensen NeighborhoodEstimated Value: $163,000 - $207,334
3
Beds
1
Bath
816
Sq Ft
$217/Sq Ft
Est. Value
About This Home
This home is located at 1908 Reid St, Houston, TX 77026 and is currently estimated at $177,084, approximately $217 per square foot. 1908 Reid St is a home located in Harris County with nearby schools including Ross Elementary School, Key Middle, and Northside High School.
Ownership History
Date
Name
Owned For
Owner Type
Purchase Details
Closed on
Aug 9, 2024
Sold by
Fobbs Kevin J and Fobbs Evelyn R
Bought by
Tucker Harvey
Current Estimated Value
Purchase Details
Closed on
Oct 14, 2016
Sold by
Hayden Ricky
Bought by
Fobbs Kevin J and Fobbs Evelyn R
Home Financials for this Owner
Home Financials are based on the most recent Mortgage that was taken out on this home.
Original Mortgage
$35,000
Interest Rate
3.5%
Mortgage Type
Purchase Money Mortgage
Purchase Details
Closed on
Nov 14, 1996
Sold by
Hayden Ricky and Green Ellen
Bought by
Hayden Ricky and Gracco Investments
Create a Home Valuation Report for This Property
The Home Valuation Report is an in-depth analysis detailing your home's value as well as a comparison with similar homes in the area
Home Values in the Area
Average Home Value in this Area
Purchase History
| Date | Buyer | Sale Price | Title Company |
|---|---|---|---|
| Tucker Harvey | -- | None Listed On Document | |
| Fobbs Kevin J | $10,000 | None Available | |
| Hayden Ricky | -- | -- |
Source: Public Records
Mortgage History
| Date | Status | Borrower | Loan Amount |
|---|---|---|---|
| Previous Owner | Fobbs Kevin J | $35,000 |
Source: Public Records
Tax History Compared to Growth
Tax History
| Year | Tax Paid | Tax Assessment Tax Assessment Total Assessment is a certain percentage of the fair market value that is determined by local assessors to be the total taxable value of land and additions on the property. | Land | Improvement |
|---|---|---|---|---|
| 2025 | $2,126 | $80,913 | $74,313 | $6,600 |
| 2024 | $2,126 | $101,600 | $81,563 | $20,037 |
| 2023 | $2,126 | $152,313 | $81,563 | $70,750 |
| 2022 | $2,660 | $120,813 | $54,375 | $66,438 |
| 2021 | $1,991 | $85,437 | $54,375 | $31,062 |
| 2020 | $1,489 | $61,477 | $29,000 | $32,477 |
| 2019 | $1,556 | $61,477 | $29,000 | $32,477 |
| 2018 | $886 | $34,999 | $16,313 | $18,686 |
| 2017 | $885 | $34,999 | $16,313 | $18,686 |
| 2016 | $885 | $34,999 | $16,313 | $18,686 |
| 2015 | $900 | $34,999 | $14,500 | $20,499 |
| 2014 | $900 | $34,999 | $14,500 | $20,499 |
Source: Public Records
Map
Nearby Homes