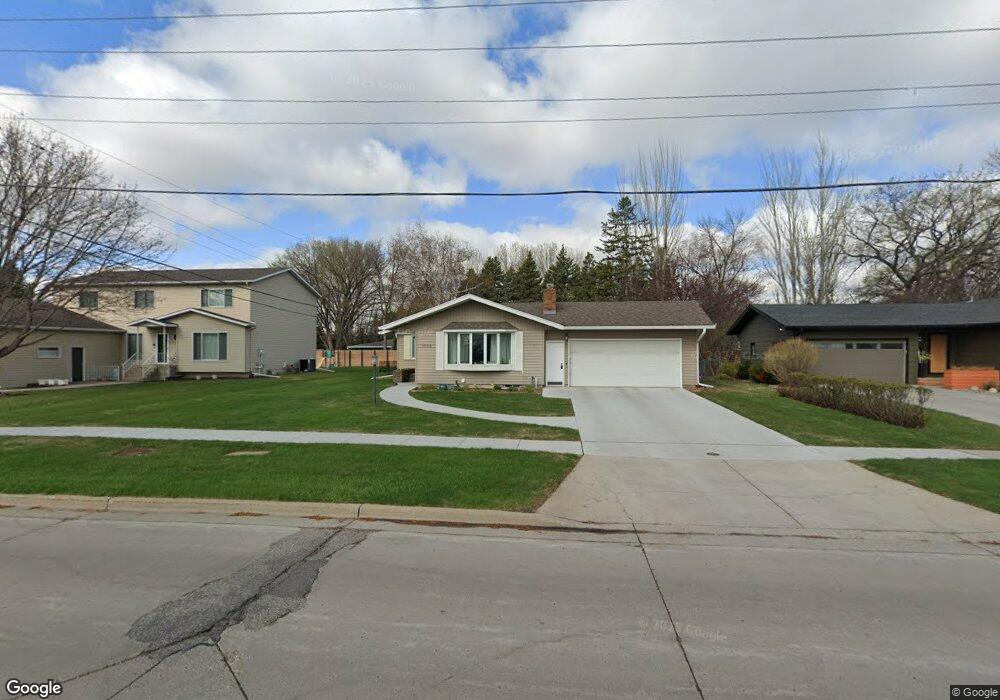
1909 5th St S Fargo, ND 58103
Clara Barton NeighborhoodEstimated Value: $299,000 - $343,000
3
Beds
3
Baths
1,313
Sq Ft
$242/Sq Ft
Est. Value
About This Home
This home is located at 1909 5th St S, Fargo, ND 58103 and is currently estimated at $317,431, approximately $241 per square foot. 1909 5th St S is a home located in Cass County with nearby schools including Clara Barton Elementary School, Carl Ben Eielson Middle School, and South High School.
Ownership History
Date
Name
Owned For
Owner Type
Purchase Details
Closed on
Jul 17, 2013
Sold by
Olson Jerry R
Bought by
Mangen Jeffrey M and Eriksmoen Marit M
Current Estimated Value
Home Financials for this Owner
Home Financials are based on the most recent Mortgage that was taken out on this home.
Original Mortgage
$176,641
Outstanding Balance
$127,822
Interest Rate
3.5%
Mortgage Type
FHA
Estimated Equity
$189,609
Create a Home Valuation Report for This Property
The Home Valuation Report is an in-depth analysis detailing your home's value as well as a comparison with similar homes in the area
Home Values in the Area
Average Home Value in this Area
Purchase History
| Date | Buyer | Sale Price | Title Company |
|---|---|---|---|
| Mangen Jeffrey M | $179,900 | Fm Title |
Source: Public Records
Mortgage History
| Date | Status | Borrower | Loan Amount |
|---|---|---|---|
| Open | Mangen Jeffrey M | $70,000 | |
| Closed | Eriksmoen Marit M | $53,192 | |
| Closed | Mangen Jeffrey M | $29,000 | |
| Open | Mangen Jeffrey M | $176,641 | |
| Previous Owner | Olson Jerome R | $1,040,000 | |
| Previous Owner | Olson Jerry R | $18,244 | |
| Previous Owner | Olson Jerry R | $17,652 | |
| Previous Owner | Olson Jerry R | $7,472 |
Source: Public Records
Tax History Compared to Growth
Tax History
| Year | Tax Paid | Tax Assessment Tax Assessment Total Assessment is a certain percentage of the fair market value that is determined by local assessors to be the total taxable value of land and additions on the property. | Land | Improvement |
|---|---|---|---|---|
| 2024 | $3,925 | $152,950 | $40,900 | $112,050 |
| 2023 | $4,136 | $142,950 | $40,900 | $102,050 |
| 2022 | $3,815 | $128,800 | $40,900 | $87,900 |
| 2021 | $3,627 | $124,100 | $40,500 | $83,600 |
| 2020 | $3,583 | $124,100 | $40,500 | $83,600 |
| 2019 | $3,373 | $116,000 | $25,300 | $90,700 |
| 2018 | $3,333 | $116,000 | $25,300 | $90,700 |
| 2017 | $3,214 | $112,600 | $25,300 | $87,300 |
| 2016 | $2,896 | $109,300 | $25,300 | $84,000 |
| 2015 | $2,440 | $84,350 | $17,200 | $67,150 |
| 2014 | $2,333 | $78,100 | $17,200 | $60,900 |
| 2013 | $2,335 | $78,100 | $17,200 | $60,900 |
Source: Public Records
Map
Nearby Homes
- 2309 9th St S
- 337 Elmwood Ave S
- 1710 14th St S
- 1439 10th St S
- 1550 13 1 2 St S
- 1834 14 1 2 St S
- 1361 16th Ave S
- 1425 11th St S
- 2517 W Country Club Dr S Unit 10
- 4813 4th St S
- 4838 4th St S
- 4817 4th St S
- 4825 4th St S
- 4847 4th St S
- 4826 4th St S
- 4849 4th St S
- 4810 4th St S
- 4841 4th St S
- 4814 4th St S
- 4808 4th St S