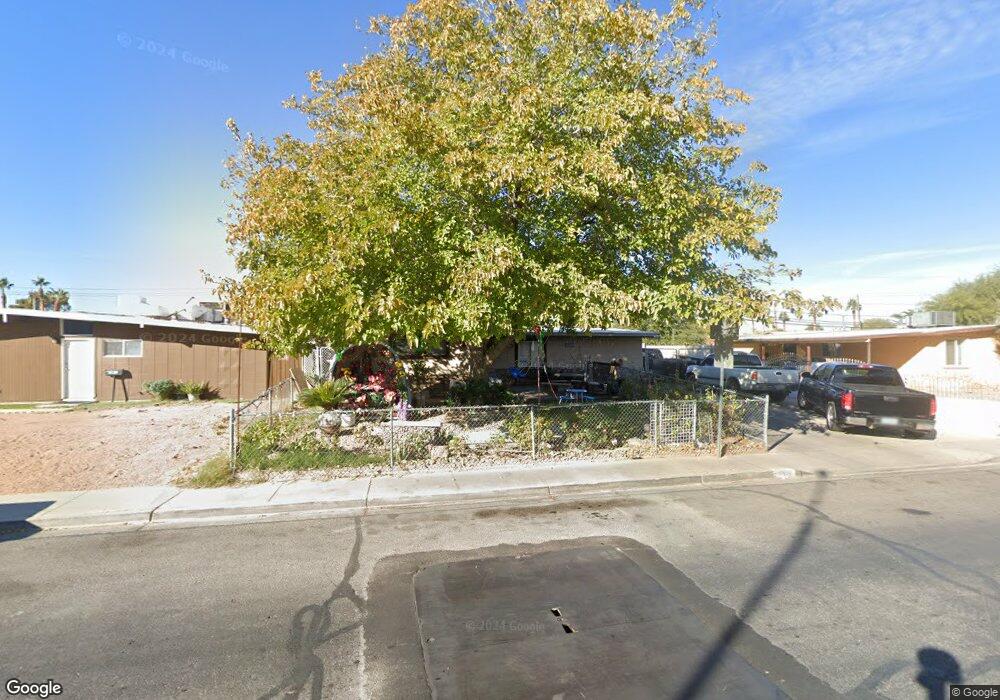
1909 Belmont St North Las Vegas, NV 89030
Downtown North Las Vegas NeighborhoodEstimated Value: $317,149 - $349,000
4
Beds
2
Baths
1,385
Sq Ft
$241/Sq Ft
Est. Value
About This Home
This home is located at 1909 Belmont St, North Las Vegas, NV 89030 and is currently estimated at $333,787, approximately $241 per square foot. 1909 Belmont St is a home located in Clark County with nearby schools including Tom Williams Elementary School, J.D. Smith Middle School, and Rancho High School.
Ownership History
Date
Name
Owned For
Owner Type
Purchase Details
Closed on
Oct 3, 2023
Sold by
Reyes Julia Flores and Calderon-Ruiz Mario
Bought by
Reyes Julia Flores
Current Estimated Value
Purchase Details
Closed on
Jan 28, 2019
Sold by
Flores Bravo Flores Luis Alberto and Flores Reyes Julia
Bought by
Reyes Julia Flores and Calderon Ruiz Mario
Home Financials for this Owner
Home Financials are based on the most recent Mortgage that was taken out on this home.
Original Mortgage
$39,000
Interest Rate
4.6%
Mortgage Type
Stand Alone First
Purchase Details
Closed on
Jan 26, 2019
Sold by
Bravo Flores Yuliana Miriam
Bought by
Calderon Ruiz Mario
Home Financials for this Owner
Home Financials are based on the most recent Mortgage that was taken out on this home.
Original Mortgage
$39,000
Interest Rate
4.6%
Mortgage Type
Stand Alone First
Purchase Details
Closed on
Mar 29, 2017
Sold by
Bravo Flores Luis Alberto
Bought by
Bravo Flores Luis Alberto and Reyes Julia Flores
Purchase Details
Closed on
Dec 17, 2012
Sold by
Mcdonald James E
Bought by
Flores Luis Alberto Bravo
Purchase Details
Closed on
Jan 30, 2004
Sold by
Mcdonald Edward L and Mcdonald Betty H
Bought by
Mcdonald Edward L and Mcdonald H
Create a Home Valuation Report for This Property
The Home Valuation Report is an in-depth analysis detailing your home's value as well as a comparison with similar homes in the area
Home Values in the Area
Average Home Value in this Area
Purchase History
| Date | Buyer | Sale Price | Title Company |
|---|---|---|---|
| Reyes Julia Flores | -- | None Listed On Document | |
| Reyes Julia Flores | $83,543 | Fidelity National Title | |
| Calderon Ruiz Mario | -- | Fidelity National Title | |
| Bravo Flores Luis Alberto | -- | None Available | |
| Flores Luis Alberto Bravo | $55,000 | Fidelity National Title Las | |
| Mcdonald Edward L | -- | -- |
Source: Public Records
Mortgage History
| Date | Status | Borrower | Loan Amount |
|---|---|---|---|
| Previous Owner | Reyes Julia Flores | $39,000 |
Source: Public Records
Tax History Compared to Growth
Tax History
| Year | Tax Paid | Tax Assessment Tax Assessment Total Assessment is a certain percentage of the fair market value that is determined by local assessors to be the total taxable value of land and additions on the property. | Land | Improvement |
|---|---|---|---|---|
| 2025 | $745 | $43,329 | $24,150 | $19,179 |
| 2024 | $691 | $43,329 | $24,150 | $19,179 |
| 2023 | $691 | $43,159 | $25,900 | $17,259 |
| 2022 | $640 | $37,164 | $21,700 | $15,464 |
| 2021 | $593 | $34,703 | $20,300 | $14,403 |
| 2020 | $547 | $33,247 | $19,250 | $13,997 |
| 2019 | $513 | $29,240 | $15,750 | $13,490 |
| 2018 | $490 | $25,271 | $12,600 | $12,671 |
| 2017 | $773 | $23,053 | $10,500 | $12,553 |
| 2016 | $460 | $19,192 | $7,000 | $12,192 |
| 2015 | $457 | $17,423 | $5,600 | $11,823 |
| 2014 | $443 | $14,949 | $4,200 | $10,749 |
Source: Public Records
Map
Nearby Homes
- 2844 Hickey Ave
- 2801 Emmons Ave
- 3308 E Lake Mead Blvd
- 1311 Flower Ave
- 3308 Tabor Ave
- 3104 Dillon Ave
- 2613 Hickey Ave
- 3024 Orr Ave
- 3601 Thomas Ave
- 2232 Bassler St
- 2252 Ellis St
- 3220 Orr Ave
- 2214 Daley St
- 2746 E Owens Ave
- 3200 E Owens Ave
- 1620 Kenneth St
- 3600 Reynolds Ave
- 1830 N Pecos Rd Unit 230
- 1830 N Pecos Rd Unit 137
- 2315 Perliter Ave
- 1915 Belmont St
- 1905 Belmont St
- 1908 Statz St
- 1917 Belmont St
- 1904 Statz St
- 3000 Emmons Ave
- 1916 Statz St
- 1900 Statz St
- 3001 Emmons Ave
- 1921 Belmont St
- 1845 Belmont St
- 3004 Emmons Ave
- 1920 Statz St
- 3001 Wright Ave
- 1856 Statz St
- 3005 Emmons Ave
- 1925 Belmont St
- 1841 Belmont St
- 2845 Emmons Ave
- 3005 Wright Ave