Estimated Value: $707,000 - $760,000
6
Beds
3
Baths
3,102
Sq Ft
$237/Sq Ft
Est. Value
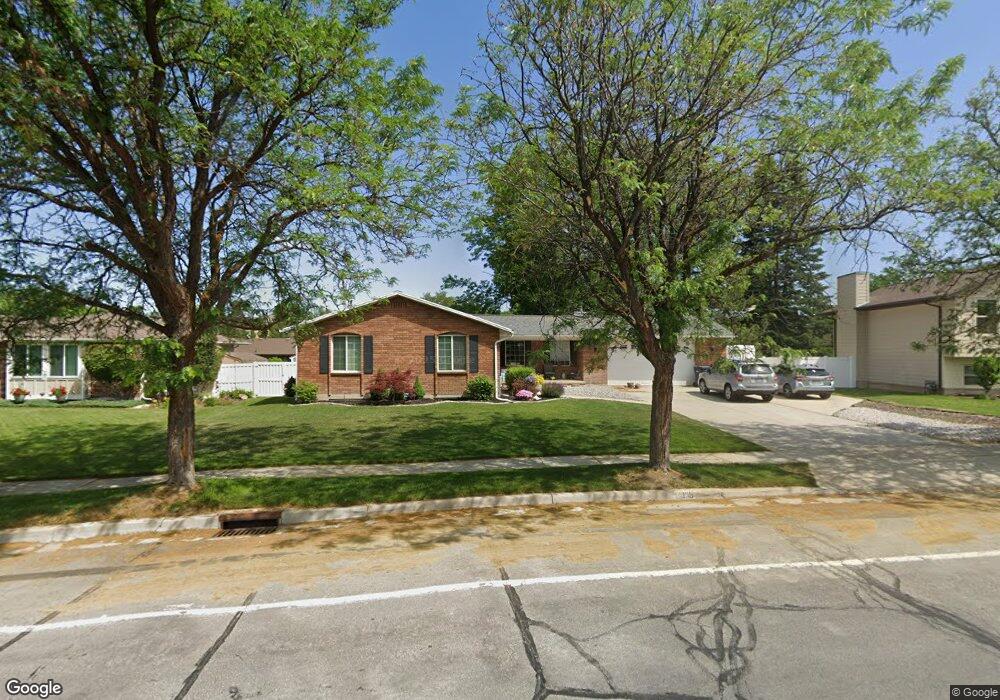
About This Home
This home is located at 1909 Falcon Way, Sandy, UT 84093 and is currently estimated at $733,652, approximately $236 per square foot. 1909 Falcon Way is a home located in Salt Lake County with nearby schools including Silver Mesa Elementary School, Albion Middle School, and Brighton High School.
Ownership History
Date
Name
Owned For
Owner Type
Purchase Details
Closed on
Jan 14, 2010
Sold by
Packard Ronald D
Bought by
Sanchez Mark J and Sanchez Melissa P
Current Estimated Value
Home Financials for this Owner
Home Financials are based on the most recent Mortgage that was taken out on this home.
Original Mortgage
$274,950
Outstanding Balance
$178,031
Interest Rate
4.68%
Mortgage Type
New Conventional
Estimated Equity
$555,621
Purchase Details
Closed on
Mar 28, 2007
Sold by
Bruderer Scott and Bruderer Jill
Bought by
Packard Packard and Purchase Johnson Money
Create a Home Valuation Report for This Property
The Home Valuation Report is an in-depth analysis detailing your home's value as well as a comparison with similar homes in the area
Home Values in the Area
Average Home Value in this Area
Purchase History
| Date | Buyer | Sale Price | Title Company |
|---|---|---|---|
| Sanchez Mark J | -- | Equity Title | |
| Packard Packard | -- | First American Title |
Source: Public Records
Mortgage History
| Date | Status | Borrower | Loan Amount |
|---|---|---|---|
| Open | Sanchez Mark J | $274,950 |
Source: Public Records
Tax History
| Year | Tax Paid | Tax Assessment Tax Assessment Total Assessment is a certain percentage of the fair market value that is determined by local assessors to be the total taxable value of land and additions on the property. | Land | Improvement |
|---|---|---|---|---|
| 2025 | $3,534 | $679,600 | $228,700 | $450,900 |
| 2024 | $3,534 | $662,500 | $217,800 | $444,700 |
| 2023 | $3,359 | $628,600 | $207,000 | $421,600 |
| 2022 | $3,185 | $586,300 | $203,000 | $383,300 |
| 2021 | $2,855 | $447,300 | $162,400 | $284,900 |
| 2020 | $2,735 | $404,500 | $162,400 | $242,100 |
| 2019 | $2,579 | $372,100 | $154,100 | $218,000 |
| 2016 | $2,346 | $327,400 | $154,100 | $173,300 |
Source: Public Records
Map
Nearby Homes
- 8921 S Shady Meadow Dr
- 1891 Richard Rd
- 9472 S Tramway Dr
- 2156 E Falcon Way
- 9078 S Daybreak Dr
- 1482 Waters Ln
- 1492 E Sandy Hills Dr
- 8638 Piper Ln
- 2333 Cliff Swallow Dr
- 8857 S Capella Way
- 2329 E Woodchuck Cir
- 1924 E Viscounti Cove
- 9650 S Buttonwood Dr
- 1952 E Bluffside Cir
- 1990 E Terra Vista Way
- 9472 Fox Hunt Dr
- 9457 S Fox Hunt Dr Unit 49
- 8483 Terrace Dr
- 1430 E 8685 S
- 9828 Pinehurst Dr
- 1909 E Falcon Way
- 1897 Falcon Way
- 1921 Falcon Way
- 1919 Falcon Way
- 1910 E Southbridge Way
- 1910 Southbridge Way
- 1898 Southbridge Way
- 1883 Falcon Way
- 1930 Southbridge Way
- 1930 E Southbridge Way
- 1933 Falcon Way
- 1886 Southbridge Way
- 1886 E Southbridge Way
- 9185 Creponette Dr
- 9185 S Creponette Dr
- 9182 Creponette Dr
- 9140 Bentham Ave
- 9158 Tortellini Dr
- 1869 Falcon Way
- 1874 Southbridge Way
Your Personal Tour Guide
Ask me questions while you tour the home.