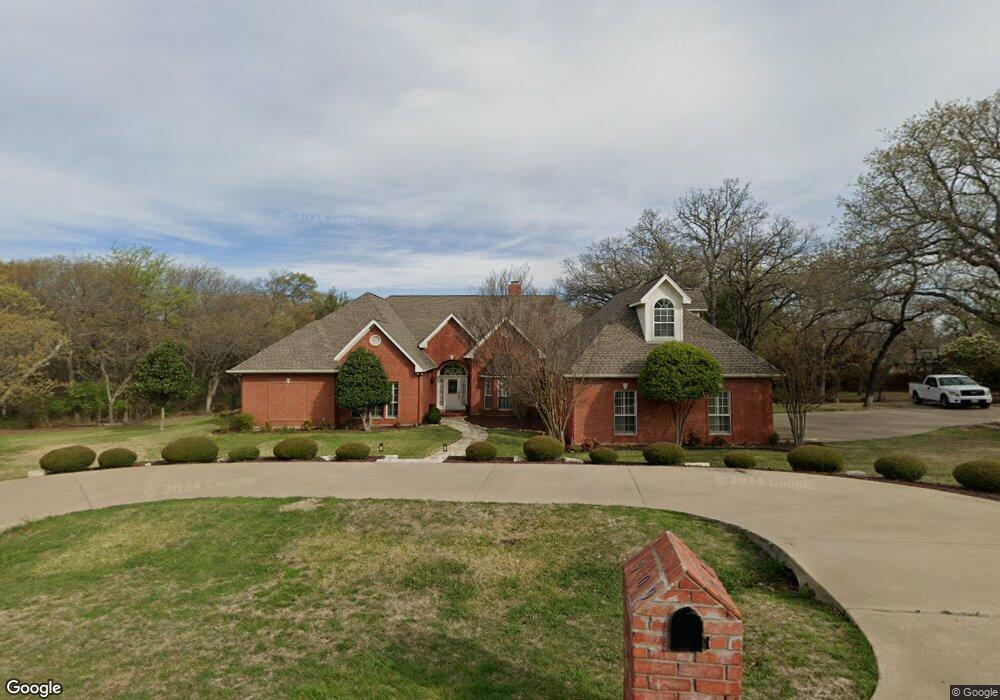
1909 Forest Glen Ln Weatherford, TX 76087
Estimated Value: $763,000 - $847,000
5
Beds
4
Baths
4,162
Sq Ft
$190/Sq Ft
Est. Value
About This Home
This home is located at 1909 Forest Glen Ln, Weatherford, TX 76087 and is currently estimated at $790,408, approximately $189 per square foot. 1909 Forest Glen Ln is a home located in Parker County with nearby schools including Austin Elementary School, Hall Middle School, and Weatherford High School.
Ownership History
Date
Name
Owned For
Owner Type
Purchase Details
Closed on
Jan 3, 2014
Sold by
Griffin Gary B and Griffin Patsy S
Bought by
Ulrich Melvin Richard and Ulrich Leslie Stroud
Current Estimated Value
Home Financials for this Owner
Home Financials are based on the most recent Mortgage that was taken out on this home.
Original Mortgage
$378,000
Outstanding Balance
$286,570
Interest Rate
4.5%
Mortgage Type
Adjustable Rate Mortgage/ARM
Estimated Equity
$503,838
Purchase Details
Closed on
Sep 3, 2003
Sold by
Watson Harold E and Watson Bette D
Bought by
Ulrich Melvin Richard and Leslie Stroud
Purchase Details
Closed on
Oct 3, 1995
Bought by
Ulrich Melvin Richard and Leslie Stroud
Purchase Details
Closed on
Apr 5, 1993
Bought by
Ulrich Melvin Richard and Leslie Stroud
Purchase Details
Closed on
Oct 4, 1989
Bought by
Ulrich Melvin Richard and Leslie Stroud
Create a Home Valuation Report for This Property
The Home Valuation Report is an in-depth analysis detailing your home's value as well as a comparison with similar homes in the area
Home Values in the Area
Average Home Value in this Area
Purchase History
| Date | Buyer | Sale Price | Title Company |
|---|---|---|---|
| Ulrich Melvin Richard | -- | None Available | |
| Ulrich Melvin Richard | -- | -- | |
| Ulrich Melvin Richard | -- | -- | |
| Ulrich Melvin Richard | -- | -- | |
| Ulrich Melvin Richard | -- | -- |
Source: Public Records
Mortgage History
| Date | Status | Borrower | Loan Amount |
|---|---|---|---|
| Open | Ulrich Melvin Richard | $378,000 |
Source: Public Records
Tax History Compared to Growth
Tax History
| Year | Tax Paid | Tax Assessment Tax Assessment Total Assessment is a certain percentage of the fair market value that is determined by local assessors to be the total taxable value of land and additions on the property. | Land | Improvement |
|---|---|---|---|---|
| 2025 | $12,489 | $753,000 | $145,000 | $608,000 |
| 2024 | $12,489 | $701,690 | -- | -- |
| 2023 | $12,489 | $637,900 | $0 | $0 |
| 2022 | $12,863 | $579,910 | $50,000 | $529,910 |
| 2021 | $13,926 | $579,910 | $50,000 | $529,910 |
| 2020 | $12,864 | $532,390 | $50,000 | $482,390 |
| 2019 | $13,180 | $532,390 | $50,000 | $482,390 |
| 2018 | $12,036 | $469,210 | $50,000 | $419,210 |
| 2017 | $12,346 | $469,210 | $50,000 | $419,210 |
| 2016 | $11,035 | $419,400 | $50,000 | $369,400 |
| 2015 | $10,807 | $419,400 | $50,000 | $369,400 |
| 2014 | $8,031 | $328,130 | $50,000 | $278,130 |
Source: Public Records
Map
Nearby Homes
- 2218 Lake Country Dr
- 104 Carriage Hill Ct
- 2214 Lake Country Dr
- 1910 Maplewood Dr
- 2020 Maplewood Dr
- 105 Country Green Ct
- 2102 Clear Creek Dr
- 2116 Clear Lake Rd
- 2202 Lakeforest Dr
- 1905 Clear Creek Dr
- 2113 Country Brook Dr
- 344 Clear Lake Ln
- 2001 Santa fe Dr
- 221 Arapahoe Ridge
- 1421 Highlake Ln
- 115 Autumn Springs Ct
- 128 Black Forest Dr
- 118 Black Forest Dr
- 101 Black Forest Dr
- 510 Lockwood Ln
- 1913 Forest Glen Ln
- 1908 Forest Glen Ln
- 1910 Forest Glen Ln
- 1912 Forest Glen Ln
- 1906 Forest Glen Ln
- 1915 Forest Glen Ln
- Lot 24 Forest Glen Rd
- Lot 20 Forest Glen Rd
- Lot 16 Forest Glen Rd
- Lot 14 Forest Glen Rd
- Lot 12 Forest Glen Rd
- Lot 10 Forest Glen Rd
- Lot 8 Forest Glen Rd
- Lot 6 Forest Glen Rd
- Lot 4 Forest Glen Rd
- Lot 2 Forest Glen Rd
- 18 Forest Glen Ct
- 2 Forest Glen Ct
- 6 Forest Glen Ct
- 22 Forest Glen Ct