1909 Kirby Rd McLean, VA 22101
Estimated Value: $1,666,000 - $2,208,000
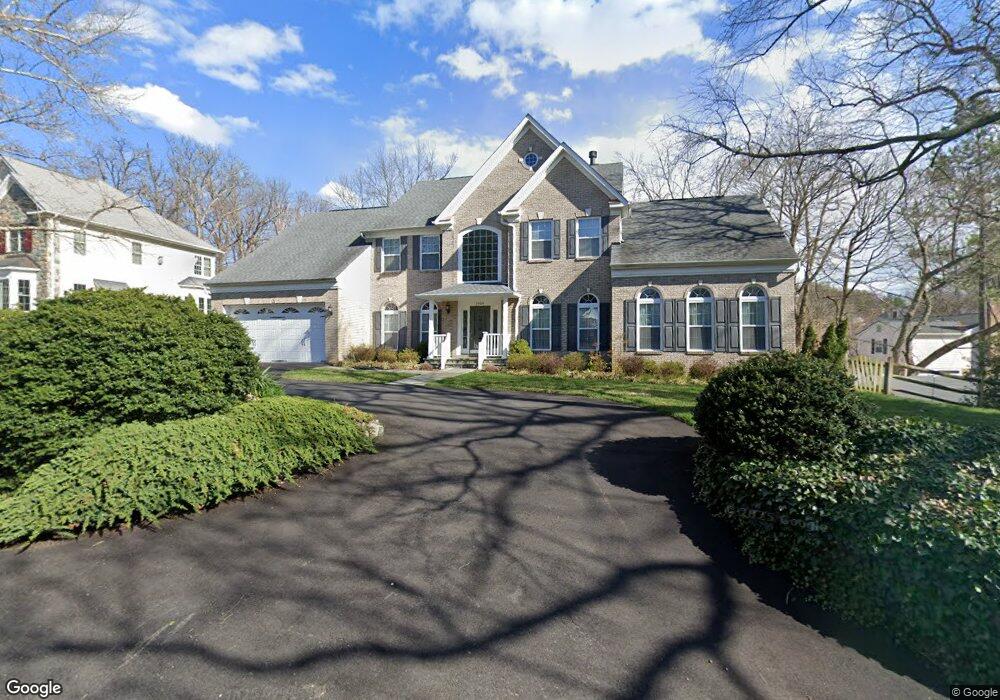
About This Home
This home is located at 1909 Kirby Rd, McLean, VA 22101 and is currently estimated at $1,985,714, approximately $479 per square foot. 1909 Kirby Rd is a home located in Fairfax County with nearby schools including Chesterbrook Elementary School, Longfellow Middle School, and McLean High School.
Ownership History
We collect this data history from publicly available records. To have your information removed, we recommend requesting removal directly through your county’s website.
Purchase Details
Home Financials for this Owner
Home Financials are based on the most recent Mortgage that was taken out on this home.Purchase Details
Purchase Details
Home Values in the Area
Average Home Value in this Area
Purchase History
We collect this data history from publicly available records. To have your information removed, we recommend requesting removal directly through your county’s website.
| Date | Buyer | Sale Price | Title Company |
|---|---|---|---|
| -- | Accommodation | ||
| -- | Accommodation | ||
| -- | None Available | ||
| -- | None Available |
Mortgage History
We collect this data history from publicly available records. To have your information removed, we recommend requesting removal directly through your county’s website.
| Date | Status | Borrower | Loan Amount |
|---|---|---|---|
| Open | $187,387 |
Tax History
We collect this data history from publicly available records. To have your information removed, we recommend requesting removal directly through your county’s website.
| Year | Tax Paid | Tax Assessment Tax Assessment Total Assessment is a certain percentage of the fair market value that is determined by local assessors to be the total taxable value of land and additions on the property. | Land | Improvement |
|---|---|---|---|---|
| 2025 | $21,925 | $1,797,220 | $604,000 | $1,193,220 |
| 2024 | $21,925 | $1,808,730 | $636,000 | $1,172,730 |
| 2023 | $21,041 | $1,784,730 | $612,000 | $1,172,730 |
| 2022 | $19,140 | $1,600,100 | $495,000 | $1,105,100 |
| 2021 | $18,939 | $1,549,450 | $471,000 | $1,078,450 |
| 2020 | $18,544 | $1,506,380 | $471,000 | $1,035,380 |
| 2019 | $16,495 | $1,472,860 | $471,000 | $1,001,860 |
| 2018 | $18,178 | $1,366,750 | $471,000 | $895,750 |
| 2017 | $18,222 | $1,509,840 | $471,000 | $1,038,840 |
| 2016 | $18,184 | $1,509,840 | $471,000 | $1,038,840 |
| 2015 | $9,320 | $507,000 | $457,000 | $50,000 |
| 2014 | $10,077 | $856,330 | $457,000 | $399,330 |
Map
- 6510 Ivy Hill Dr
- 1914 Birch Rd
- 1903 Torregrossa Ct
- 6449 Johns Rd
- 1905 Lamson Place
- 6413 Noble Dr
- 1805 Franklin Ave
- 6426 Noble Dr
- 1917 Kenbar Ct
- 6605 Jerry Place
- 1806 Barbee St
- 6514 Byrnes Dr
- 2026 Mayfair Mclean Ct
- 1846 Patton Terrace
- 6606 Tucker Ave
- 6514 Fairlawn Dr
- 2087 Hopewood Dr
- 1914 Virginia Ave
- 6529 Fairlawn Dr
- 2107 Haycock Rd
- 1907 Kirby Rd
- 1923 Powhatan St
- 1921 Powhatan St
- 1911 Kirby Rd
- 1925 Powhatan St
- 1905 Kirby Rd
- 1927 Powhatan St
- 1906 Kirby Rd
- 6512 Ivy Hill Dr
- 1912 Birch Rd
- 1904 Kirby Rd
- 1914 Kirby Rd
- 1929 Powhatan St
- 1920 Powhatan St
- 6513 Ivy Hill Dr
- 1921 Relda Ct
- 1918 Kirby Rd
- 6514 Ivy Hill Dr
- 1928 Powhatan St
- 1901 Kirby Rd
Ask me questions while you tour the home.