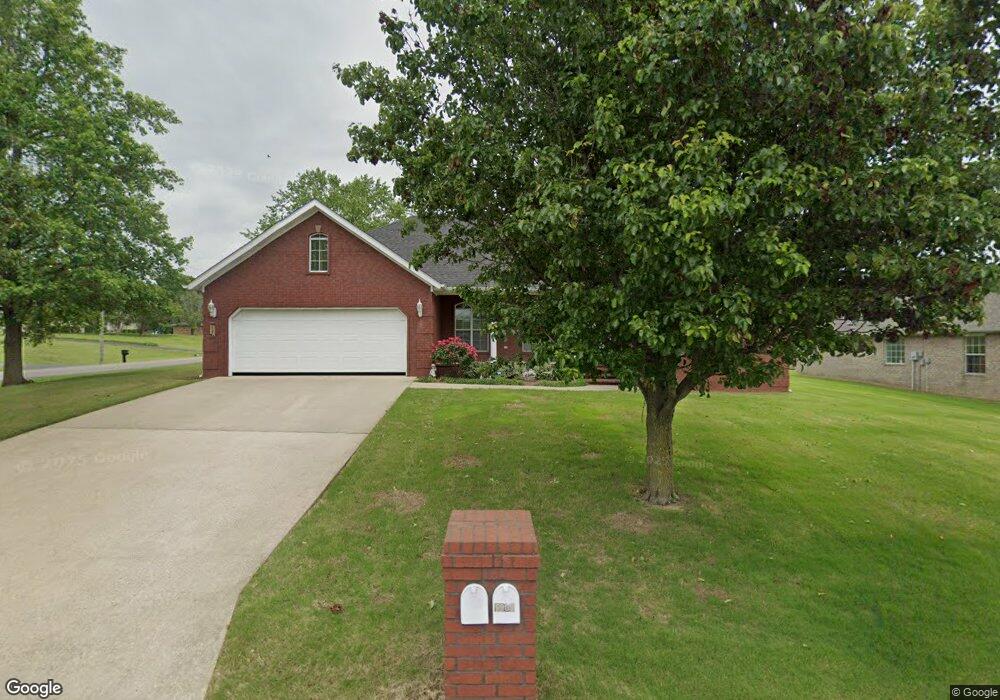
1909 N 18th St Paragould, AR 72450
Estimated Value: $223,000 - $231,000
--
Bed
2
Baths
1,841
Sq Ft
$124/Sq Ft
Est. Value
About This Home
This home is located at 1909 N 18th St, Paragould, AR 72450 and is currently estimated at $227,381, approximately $123 per square foot. 1909 N 18th St is a home located in Greene County with nearby schools including Paragould High School and St. Mary's Catholic School & Preschool.
Ownership History
Date
Name
Owned For
Owner Type
Purchase Details
Closed on
Sep 12, 2016
Sold by
Mcfarland Janet
Bought by
Mcfarland Janet
Current Estimated Value
Purchase Details
Closed on
Oct 3, 2005
Sold by
Gazaway Jimmy and Gazaway Charlotte
Bought by
Mcfarland Marion W and Mcfarland Janet
Purchase Details
Closed on
Mar 21, 2005
Sold by
Fairview Hills Properties Llc
Bought by
Gazaway Jimmy and Gazaway Charlotte
Home Financials for this Owner
Home Financials are based on the most recent Mortgage that was taken out on this home.
Original Mortgage
$100,000
Interest Rate
5.67%
Mortgage Type
FHA
Purchase Details
Closed on
Jul 16, 2004
Bought by
Fairview Hills Iii Restrictive
Purchase Details
Closed on
Jun 28, 2004
Bought by
F Hills Prop Llc
Purchase Details
Closed on
Jul 23, 1999
Bought by
Fairview Hills Dev
Create a Home Valuation Report for This Property
The Home Valuation Report is an in-depth analysis detailing your home's value as well as a comparison with similar homes in the area
Home Values in the Area
Average Home Value in this Area
Purchase History
| Date | Buyer | Sale Price | Title Company |
|---|---|---|---|
| Mcfarland Janet | -- | None Available | |
| Mcfarland Marion W | $128,000 | None Available | |
| Gazaway Jimmy | $16,000 | None Available | |
| Fairview Hills Iii Restrictive | -- | -- | |
| F Hills Prop Llc | $50,000 | -- | |
| Fairview Hills Dev | $356,000 | -- |
Source: Public Records
Mortgage History
| Date | Status | Borrower | Loan Amount |
|---|---|---|---|
| Previous Owner | Gazaway Jimmy | $100,000 |
Source: Public Records
Tax History Compared to Growth
Tax History
| Year | Tax Paid | Tax Assessment Tax Assessment Total Assessment is a certain percentage of the fair market value that is determined by local assessors to be the total taxable value of land and additions on the property. | Land | Improvement |
|---|---|---|---|---|
| 2025 | $1,010 | $41,430 | $5,000 | $36,430 |
| 2024 | $1,010 | $41,430 | $5,000 | $36,430 |
| 2023 | $1,010 | $32,490 | $4,500 | $27,990 |
| 2022 | $635 | $32,490 | $4,500 | $27,990 |
| 2021 | $635 | $32,490 | $4,500 | $27,990 |
| 2020 | $1,002 | $27,470 | $4,900 | $22,570 |
| 2019 | $627 | $27,470 | $4,900 | $22,570 |
| 2018 | $652 | $27,470 | $4,900 | $22,570 |
| 2017 | $971 | $27,470 | $4,900 | $22,570 |
| 2016 | $621 | $27,470 | $4,900 | $22,570 |
| 2015 | $979 | $23,720 | $3,400 | $20,320 |
| 2014 | -- | $23,720 | $3,400 | $20,320 |
Source: Public Records
Map
Nearby Homes
- 106 N 17th St
- 2102 N 22nd St
- 5 Arkansas 135
- 1201 William Hall Dr
- 1110 Roberts Dr
- 1803 Pete's Place
- 1803 Petes Place
- 1106 Roberts Dr
- 1427 Reynolds Rd
- 2601 Hatcher Dr
- 2300 Mount Carmel Rd
- 2200 N 8 1/2 St
- 21 N 29th St
- 18 N 29th St
- Lot 18 N 29th St
- 20 N 29th St
- Lot 20 N 29th St
- Lot 21 N 29th St
- Lot 21B N 8 1 2 St
- 0 Highway 49 N - Thiel