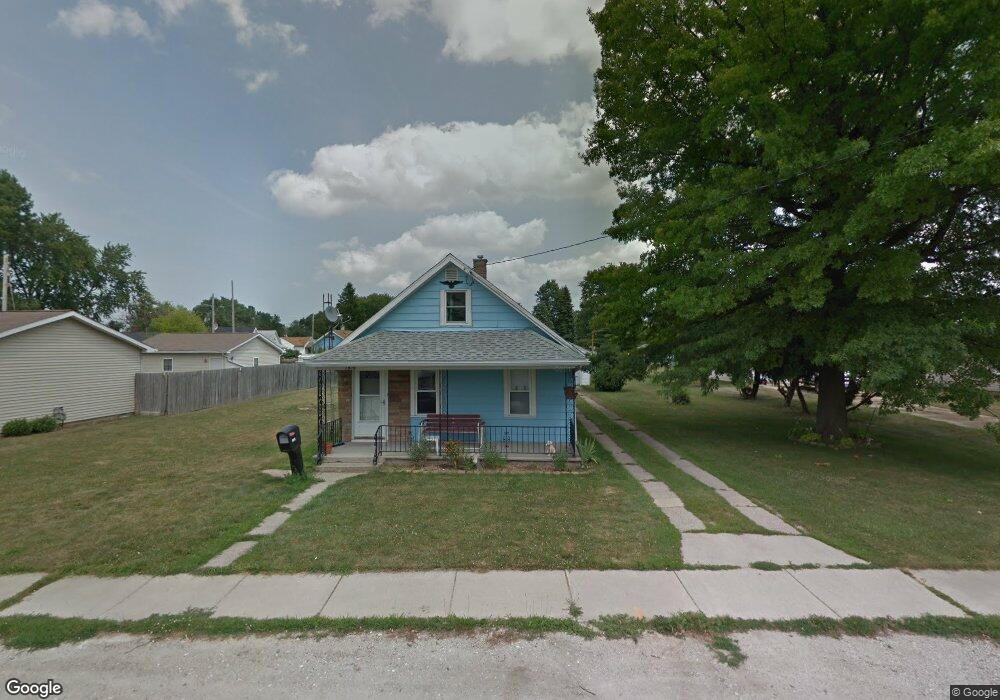
1909 Owen St Northwood, OH 43619
Estimated Value: $60,000 - $83,000
2
Beds
1
Bath
528
Sq Ft
$133/Sq Ft
Est. Value
About This Home
This home is located at 1909 Owen St, Northwood, OH 43619 and is currently estimated at $70,346, approximately $133 per square foot. 1909 Owen St is a home located in Wood County with nearby schools including Northwood Elementary School, Northwood High School, and L. Hollingworth School For Talented And Gifted.
Ownership History
Date
Name
Owned For
Owner Type
Purchase Details
Closed on
Sep 5, 2012
Sold by
Estate Of Nancy L Rice
Bought by
Rice Perry and Jakubec Paula
Current Estimated Value
Purchase Details
Closed on
Oct 12, 2004
Sold by
Rice Clarence R and Rice Nancy L
Bought by
Rice Clarence R and Rice Nancy L
Purchase Details
Closed on
Aug 6, 2004
Sold by
Fannie Mae
Bought by
Rice Clarence R and Rice Nancy L
Purchase Details
Closed on
Jan 23, 2004
Sold by
Bond Steven D
Bought by
Federal National Mortgage Association
Purchase Details
Closed on
May 25, 1995
Sold by
Martin Frances E
Bought by
Smith Jennifer M
Home Financials for this Owner
Home Financials are based on the most recent Mortgage that was taken out on this home.
Original Mortgage
$22,500
Interest Rate
8.4%
Mortgage Type
New Conventional
Purchase Details
Closed on
Jun 15, 1976
Bought by
Martin Frances E
Create a Home Valuation Report for This Property
The Home Valuation Report is an in-depth analysis detailing your home's value as well as a comparison with similar homes in the area
Home Values in the Area
Average Home Value in this Area
Purchase History
| Date | Buyer | Sale Price | Title Company |
|---|---|---|---|
| Rice Perry | -- | None Available | |
| Rice Clarence R | -- | -- | |
| Rice Clarence R | $31,000 | -- | |
| Federal National Mortgage Association | $52,000 | -- | |
| Smith Jennifer M | $26,000 | -- | |
| Martin Frances E | -- | -- |
Source: Public Records
Mortgage History
| Date | Status | Borrower | Loan Amount |
|---|---|---|---|
| Previous Owner | Smith Jennifer M | $22,500 |
Source: Public Records
Tax History Compared to Growth
Tax History
| Year | Tax Paid | Tax Assessment Tax Assessment Total Assessment is a certain percentage of the fair market value that is determined by local assessors to be the total taxable value of land and additions on the property. | Land | Improvement |
|---|---|---|---|---|
| 2024 | $764 | $16,205 | $3,850 | $12,355 |
| 2023 | $764 | $16,210 | $3,850 | $12,360 |
| 2022 | $751 | $13,240 | $2,910 | $10,330 |
| 2021 | $765 | $13,240 | $2,910 | $10,330 |
| 2020 | $761 | $13,240 | $2,910 | $10,330 |
| 2019 | $738 | $11,590 | $2,910 | $8,680 |
| 2018 | $734 | $11,590 | $2,910 | $8,680 |
| 2017 | $766 | $11,590 | $2,910 | $8,680 |
| 2016 | $810 | $12,640 | $2,910 | $9,730 |
| 2015 | $810 | $12,640 | $2,910 | $9,730 |
| 2014 | $803 | $12,640 | $2,910 | $9,730 |
| 2013 | $777 | $12,640 | $2,910 | $9,730 |
Source: Public Records
Map
Nearby Homes