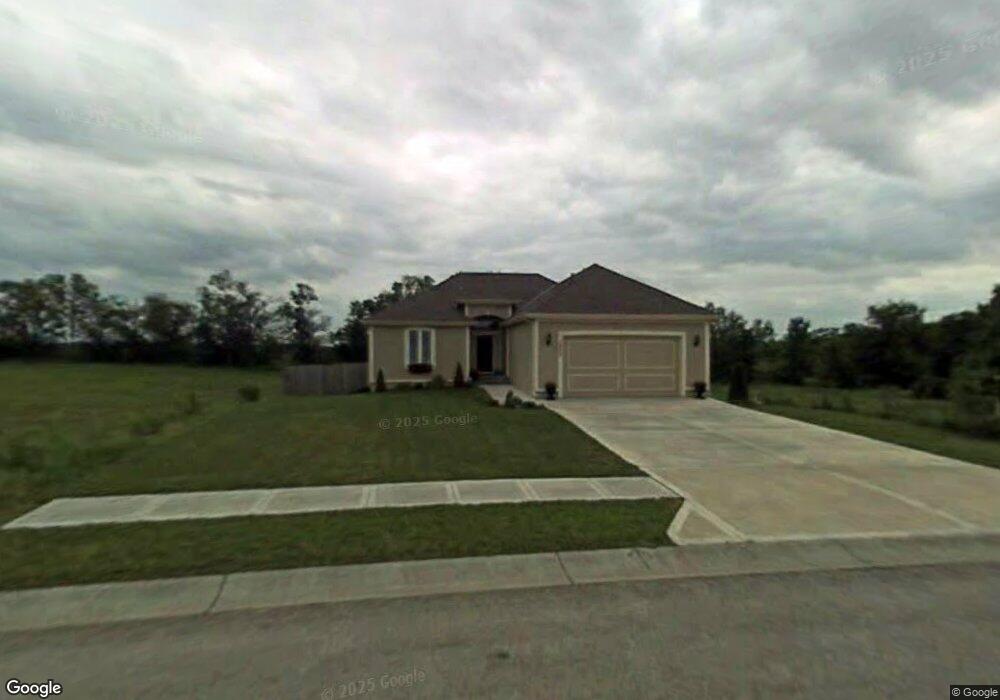
1909 Red Bud Ct Raymore, MO 64083
Estimated Value: $362,000 - $424,000
5
Beds
3
Baths
1,301
Sq Ft
$300/Sq Ft
Est. Value
About This Home
This home is located at 1909 Red Bud Ct, Raymore, MO 64083 and is currently estimated at $390,488, approximately $300 per square foot. 1909 Red Bud Ct is a home located in Cass County with nearby schools including Timber Creek Elementary School, Raymore-Peculiar East Middle School, and Raymore-Peculiar Senior High School.
Ownership History
Date
Name
Owned For
Owner Type
Purchase Details
Closed on
Aug 18, 2006
Sold by
Hinken Construction Inc
Bought by
Roberts Linda D
Current Estimated Value
Home Financials for this Owner
Home Financials are based on the most recent Mortgage that was taken out on this home.
Original Mortgage
$172,000
Outstanding Balance
$102,137
Interest Rate
6.75%
Mortgage Type
New Conventional
Estimated Equity
$288,351
Purchase Details
Closed on
Dec 14, 2005
Sold by
Ripley Properties Llc
Bought by
Hinken Construction Inc
Home Financials for this Owner
Home Financials are based on the most recent Mortgage that was taken out on this home.
Original Mortgage
$171,990
Interest Rate
6.3%
Mortgage Type
Construction
Create a Home Valuation Report for This Property
The Home Valuation Report is an in-depth analysis detailing your home's value as well as a comparison with similar homes in the area
Home Values in the Area
Average Home Value in this Area
Purchase History
| Date | Buyer | Sale Price | Title Company |
|---|---|---|---|
| Roberts Linda D | -- | -- | |
| Hinken Construction Inc | -- | -- |
Source: Public Records
Mortgage History
| Date | Status | Borrower | Loan Amount |
|---|---|---|---|
| Open | Roberts Linda D | $172,000 | |
| Previous Owner | Hinken Construction Inc | $171,990 |
Source: Public Records
Tax History
| Year | Tax Paid | Tax Assessment Tax Assessment Total Assessment is a certain percentage of the fair market value that is determined by local assessors to be the total taxable value of land and additions on the property. | Land | Improvement |
|---|---|---|---|---|
| 2025 | $3,700 | $50,930 | $7,320 | $43,610 |
| 2024 | $3,700 | $45,470 | $6,650 | $38,820 |
| 2023 | $3,695 | $45,470 | $6,650 | $38,820 |
| 2022 | $3,277 | $40,060 | $6,650 | $33,410 |
| 2021 | $3,278 | $40,060 | $6,650 | $33,410 |
| 2020 | $3,302 | $39,640 | $6,650 | $32,990 |
| 2019 | $3,188 | $39,640 | $6,650 | $32,990 |
| 2018 | $2,904 | $34,880 | $5,500 | $29,380 |
| 2017 | $2,657 | $34,880 | $5,500 | $29,380 |
| 2016 | $2,657 | $33,120 | $5,500 | $27,620 |
| 2015 | $2,659 | $33,120 | $5,500 | $27,620 |
| 2014 | $2,615 | $32,560 | $5,500 | $27,060 |
| 2013 | -- | $32,560 | $5,500 | $27,060 |
Source: Public Records
Map
Nearby Homes
- 2000 Parkview Dr
- 1900 Red Bud Ct
- 2110 Chateau Place
- 1839 Woodward Cir
- 1826 Woodward Cir
- 1838 Woodward Cir
- 1808 Hall's Creek Ave
- 1806 Hall's Creek Ave
- 1816 Woodward Cir
- 1822 Woodward Cir
- 1820 Woodward Cir
- 1833 Woodward Cir
- 1804 Halls Creek Dr
- 2101 Creek View Ln
- 1812 Halls Creek Ave
- 1810 Halls Creek Ave
- 1808 Halls Creek Ave
- 2201 Creek View Ln
- 2216 Creek View Ln
- 2215 Creek View Ln
- 1907 Red Bud Ct
- 1911 Red Bud Ct
- 1905 Red Bud Ct
- 1913 Red Bud Ct
- 1917 Parkview Dr
- 1908 Red Bud Ct
- 1906 Red Bud Ct
- 1903 Red Bud Ct
- 1915 Red Bud Ct
- 1910 Red Bud Ct
- 1904 Red Bud Ct
- 1913 Parkview Dr
- 1919 Parkview Dr
- 1902 Red Bud Ct
- 1911 Parkview Dr
- 1921 Parkview Dr
- 2175 E Sierra Dr
- 2177 E Sierra Dr
- 2173 E Sierra Dr
- 1918 Parkview Dr
Your Personal Tour Guide
Ask me questions while you tour the home.