
Seller's Agent in 2020
Paul Tommey
Executive Group Realty LLC
(762) 822-6411
17 in this area
51 Total Sales


Estimated Value: $303,028 - $325,000
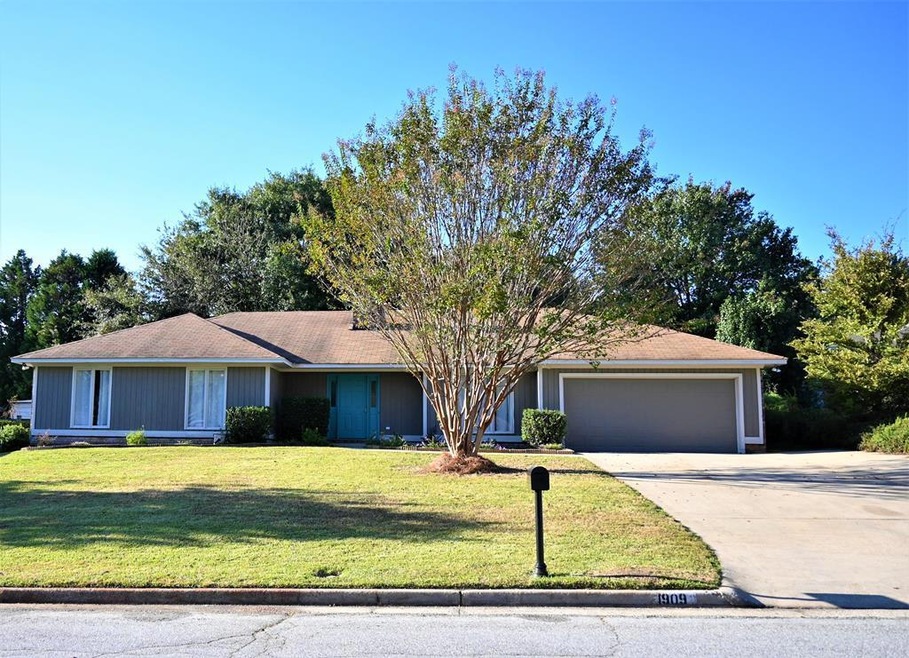
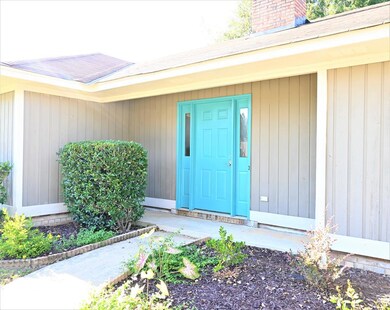
Run don't walk to this newly renovated home. It is a 4 bedroom,2 bathroom home in a well-established North Columbus neighborhood. Very close to shopping, schools and Veterans Pkwy. Updated features in the home to include painting (rooms, cabinets, and closets), new flooring throughout, and all new appliances in the kitchen. 2 car attached garage with a fenced backyard. Master suite is in the back of the home and has a tub and separate shower. Come take a look today!
Last Agent to Sell the Property
Executive Group Realty LLC Brokerage Phone: 7065071899 License #345478 Listed on: 10/10/2020
| Date | Buyer | Sale Price | Title Company |
|---|---|---|---|
| Leja Michael W | $230,000 | -- | |
| Johnson Otha D | -- | None Available | |
| Johnson Otha D | $179,100 | None Available |
| Date | Status | Borrower | Loan Amount |
|---|---|---|---|
| Open | Leja Michael W | $238,280 | |
| Previous Owner | Johnson Otha D | $182,950 |
| Date | Event | Price | List to Sale | Price per Sq Ft |
|---|---|---|---|---|
| 08/18/2024 08/18/24 | Off Market | $230,000 | -- | -- |
| 11/12/2020 11/12/20 | Sold | $230,000 | 0.0% | $119 / Sq Ft |
| 10/12/2020 10/12/20 | Pending | -- | -- | -- |
| 10/10/2020 10/10/20 | For Sale | $229,900 | -- | $119 / Sq Ft |
| Year | Tax Paid | Tax Assessment Tax Assessment Total Assessment is a certain percentage of the fair market value that is determined by local assessors to be the total taxable value of land and additions on the property. | Land | Improvement |
|---|---|---|---|---|
| 2025 | $4,370 | $111,632 | $13,208 | $98,424 |
| 2024 | $4,370 | $111,632 | $13,208 | $98,424 |
| 2023 | $4,397 | $111,632 | $13,208 | $98,424 |
| 2022 | $3,678 | $90,072 | $13,208 | $76,864 |
| 2021 | $3,673 | $89,960 | $13,208 | $76,752 |
| 2020 | $2,377 | $63,064 | $13,208 | $49,856 |
| 2019 | $2,387 | $63,064 | $13,208 | $49,856 |
| 2018 | $2,387 | $63,064 | $13,208 | $49,856 |
| 2017 | $2,396 | $63,064 | $13,208 | $49,856 |
| 2016 | $2,406 | $71,601 | $8,800 | $62,801 |
| 2015 | $2,410 | $71,601 | $8,800 | $62,801 |
| 2014 | $2,413 | $71,601 | $8,800 | $62,801 |
| 2013 | -- | $71,601 | $8,800 | $62,801 |
Seller's Agent in 2020
Paul Tommey
Executive Group Realty LLC
(762) 822-6411
17 in this area
51 Total Sales
B
Buyer's Agent in 2020
Bobbie Hill
Century 21 Premier Real Estate
(706) 587-7029
13 in this area
87 Total Sales
Source: Columbus Board of REALTORS® (GA)
MLS Number: 181685
APN: 190-031-026
Disclaimer: Certain information contained herein is derived from information provided by parties other than Homes.com. All information provided is deemed reliable, but is not guaranteed to be accurate and should be independently verified.
![]() IDX information is provided exclusively for personal, non-commercial use, and may not be used for any purpose other than to identify prospective properties consumers may be interested in purchasing. Information is deemed reliable but not guaranteed.
IDX information is provided exclusively for personal, non-commercial use, and may not be used for any purpose other than to identify prospective properties consumers may be interested in purchasing. Information is deemed reliable but not guaranteed.