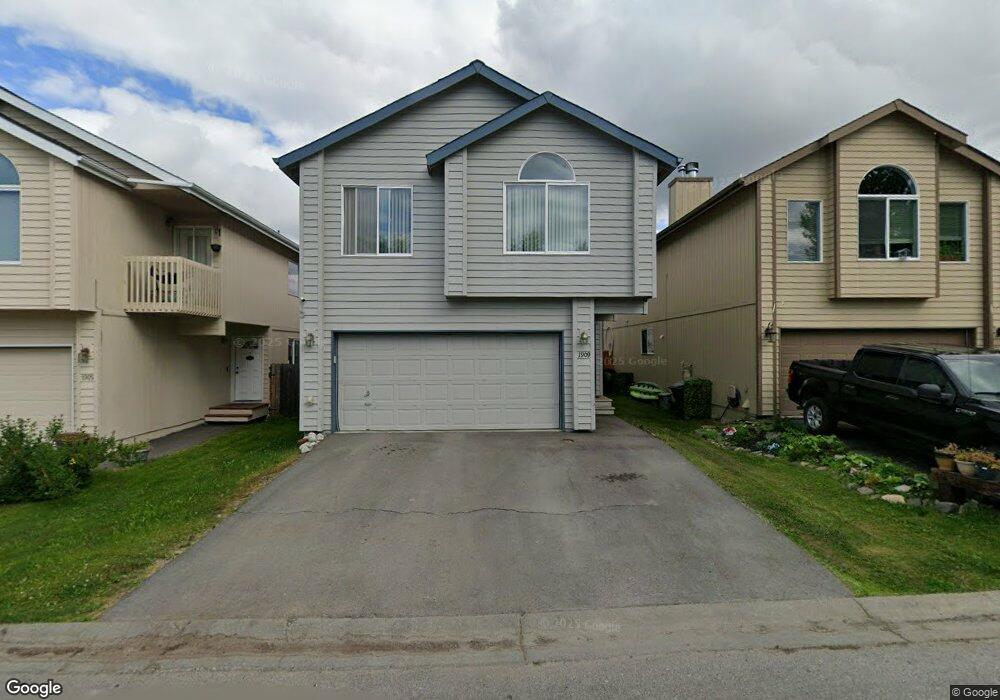
1909 Sturbridge Ct Unit 56 Anchorage, AK 99507
Abbott Loop NeighborhoodEstimated Value: $274,000 - $422,000
3
Beds
2
Baths
1,745
Sq Ft
$205/Sq Ft
Est. Value
About This Home
This home is located at 1909 Sturbridge Ct Unit 56, Anchorage, AK 99507 and is currently estimated at $358,053, approximately $205 per square foot. 1909 Sturbridge Ct Unit 56 is a home located in Anchorage Municipality with nearby schools including Spring Hill Elementary School, Hanshew Middle School, and Service High School.
Ownership History
Date
Name
Owned For
Owner Type
Purchase Details
Closed on
Apr 11, 2016
Sold by
Ridao John and Ridao Virginia
Bought by
Ridao John
Current Estimated Value
Home Financials for this Owner
Home Financials are based on the most recent Mortgage that was taken out on this home.
Original Mortgage
$223,300
Interest Rate
3.64%
Purchase Details
Closed on
Feb 13, 2008
Sold by
Hosack Brent A and Hosack Jodie
Bought by
Ridao John and Ridao Virginia
Home Financials for this Owner
Home Financials are based on the most recent Mortgage that was taken out on this home.
Original Mortgage
$247,000
Interest Rate
6.04%
Purchase Details
Closed on
May 1, 2002
Sold by
Discovery Construction Inc
Bought by
Hosack Brent A
Home Financials for this Owner
Home Financials are based on the most recent Mortgage that was taken out on this home.
Original Mortgage
$151,312
Interest Rate
7.13%
Mortgage Type
Purchase Money Mortgage
Create a Home Valuation Report for This Property
The Home Valuation Report is an in-depth analysis detailing your home's value as well as a comparison with similar homes in the area
Home Values in the Area
Average Home Value in this Area
Purchase History
| Date | Buyer | Sale Price | Title Company |
|---|---|---|---|
| Ridao John | -- | First Amer Title Ins Co Mtg | |
| Ridao John | -- | None Available | |
| Hosack Brent A | -- | First American Title |
Source: Public Records
Mortgage History
| Date | Status | Borrower | Loan Amount |
|---|---|---|---|
| Previous Owner | Ridao John | $223,300 | |
| Previous Owner | Ridao John | $247,000 | |
| Previous Owner | Hosack Brent A | $151,312 |
Source: Public Records
Tax History Compared to Growth
Tax History
| Year | Tax Paid | Tax Assessment Tax Assessment Total Assessment is a certain percentage of the fair market value that is determined by local assessors to be the total taxable value of land and additions on the property. | Land | Improvement |
|---|---|---|---|---|
| 2025 | $4,990 | $350,700 | -- | $350,700 |
| 2024 | $4,990 | $309,100 | $0 | $309,100 |
| 2023 | $4,957 | $291,100 | $0 | $291,100 |
| 2022 | $4,909 | $291,500 | $0 | $291,500 |
| 2021 | $5,033 | $279,300 | $0 | $279,300 |
| 2020 | $4,534 | $266,700 | $0 | $266,700 |
| 2019 | $4,417 | $270,000 | $0 | $270,000 |
| 2018 | $4,482 | $273,300 | $0 | $273,300 |
| 2017 | $4,216 | $269,200 | $0 | $269,200 |
| 2016 | $3,618 | $263,900 | $0 | $263,900 |
| 2015 | $3,618 | $258,200 | $0 | $258,200 |
| 2014 | $3,618 | $235,600 | $0 | $235,600 |
Source: Public Records
Map
Nearby Homes
- 1914 Sturbridge Ct Unit 3
- 1917 Colony Place Unit 33
- 10260 Jamestown Dr Unit A8
- 2060 Sturbridge Cir
- 9730 Vanguard Dr Unit 12
- 9700 Vanguard Dr Unit 70
- 1900-1941 Marthas Vineyard Cir
- 9710 Vanguard Dr Unit 80
- 10261 Arborvitae Dr
- 1611 Betula Cir
- 10285 Arborvitae Dr
- 9599 Brayton Dr Unit 422
- 8000 Independence Park Dr
- 9830 Reliance Dr
- 10359 Valley Park Dr
- 10009 Thimble Berry Dr
- 267 Loop Unit 267
- 1510 Elcadore Dr Unit 134
- 1540 Elcadore Dr Unit 125
- 10412 Thimble Berry Dr
- 1913 Sturbridge Ct Unit 57
- 1913 Sturbridge Ct Unit 28
- 1913 Sturbridge Ct Unit 57
- 1905 Sturbridge Ct Unit 55
- 1901 Sturbridge Ct Unit 54
- 1901 Sturbridge Ct Unit 54
- 1902 Sturbridge Ct Unit 6
- 1906 Sturbridge Ct Unit 5
- 1906 Sturbridge Ct
- 1924 Colony Place Unit 45
- 1928 Colony Place Unit 44
- 1925 Sturbridge Ct Unit 60
- 1828 Sturbridge Ct Unit 7
- 1918 Sturbridge Ct Unit 2
- 1922 Sturbridge Ct Unit 1
- 1932 Colony Place Unit 43
- 1936 Colony Place Unit 42
- 1916 Colony Place Unit 46
- 1814 Colony Place Unit 52
- 1905 Colony Place Unit 30