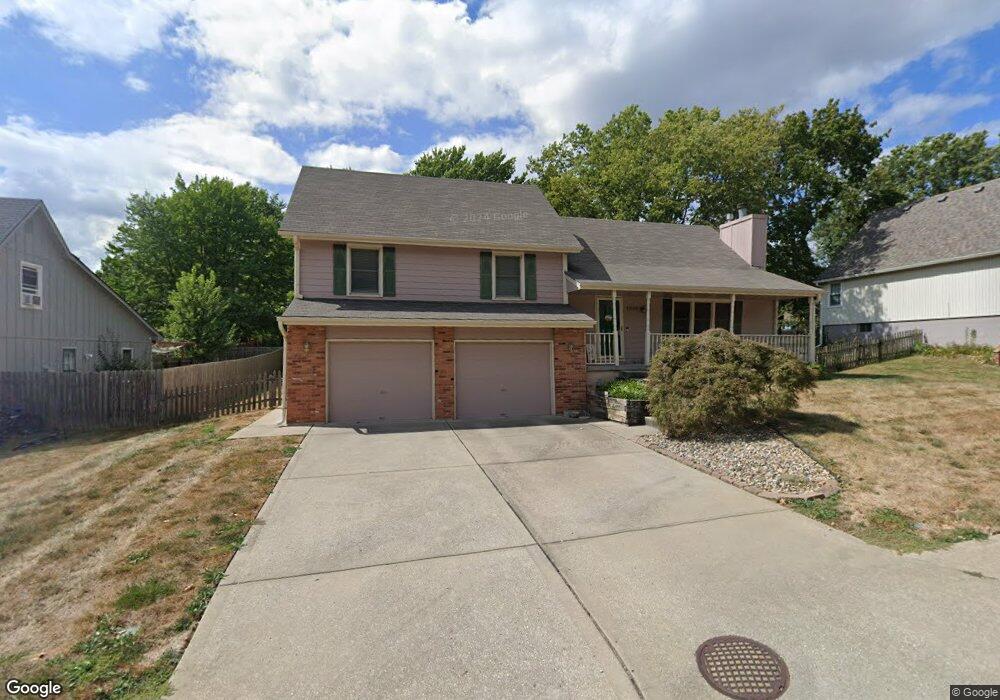
1909 SW 14th St Blue Springs, MO 64015
Estimated Value: $334,238 - $377,000
3
Beds
3
Baths
1,644
Sq Ft
$214/Sq Ft
Est. Value
About This Home
This home is located at 1909 SW 14th St, Blue Springs, MO 64015 and is currently estimated at $352,560, approximately $214 per square foot. 1909 SW 14th St is a home located in Jackson County with nearby schools including Cordill-Mason Elementary School, Moreland Ridge Middle School, and Blue Springs South High School.
Ownership History
Date
Name
Owned For
Owner Type
Purchase Details
Closed on
Sep 20, 2024
Sold by
Casteel Rita Fay
Bought by
Casteel Rita Fay
Current Estimated Value
Home Financials for this Owner
Home Financials are based on the most recent Mortgage that was taken out on this home.
Original Mortgage
$73,000
Outstanding Balance
$72,183
Interest Rate
6.49%
Mortgage Type
New Conventional
Estimated Equity
$280,377
Purchase Details
Closed on
Aug 23, 2001
Sold by
Bolles Jimmy Lee and Bolles Sandra Lord
Bought by
Casteel Duane and Casteel Rita
Home Financials for this Owner
Home Financials are based on the most recent Mortgage that was taken out on this home.
Original Mortgage
$135,600
Interest Rate
7.16%
Mortgage Type
Purchase Money Mortgage
Purchase Details
Closed on
Aug 13, 1998
Sold by
Hartley Jane F
Bought by
Hartley Christopher Matthew
Create a Home Valuation Report for This Property
The Home Valuation Report is an in-depth analysis detailing your home's value as well as a comparison with similar homes in the area
Home Values in the Area
Average Home Value in this Area
Purchase History
| Date | Buyer | Sale Price | Title Company |
|---|---|---|---|
| Casteel Rita Fay | -- | Alliance Title | |
| Casteel Duane | -- | Stewart Title | |
| Hartley Christopher Matthew | -- | -- |
Source: Public Records
Mortgage History
| Date | Status | Borrower | Loan Amount |
|---|---|---|---|
| Open | Casteel Rita Fay | $73,000 | |
| Previous Owner | Casteel Duane | $135,600 |
Source: Public Records
Tax History Compared to Growth
Tax History
| Year | Tax Paid | Tax Assessment Tax Assessment Total Assessment is a certain percentage of the fair market value that is determined by local assessors to be the total taxable value of land and additions on the property. | Land | Improvement |
|---|---|---|---|---|
| 2025 | $4,210 | $57,792 | $8,812 | $48,980 |
| 2024 | $4,129 | $51,606 | $9,006 | $42,600 |
| 2023 | $4,129 | $51,606 | $5,176 | $46,430 |
| 2022 | $3,957 | $43,700 | $7,068 | $36,632 |
| 2021 | $3,953 | $43,700 | $7,068 | $36,632 |
| 2020 | $3,385 | $38,065 | $7,068 | $30,997 |
| 2019 | $3,273 | $38,065 | $7,068 | $30,997 |
| 2018 | $3,091 | $34,611 | $4,387 | $30,224 |
| 2017 | $3,006 | $34,611 | $4,387 | $30,224 |
| 2016 | $3,006 | $33,744 | $5,624 | $28,120 |
| 2014 | $3,074 | $34,397 | $5,152 | $29,245 |
Source: Public Records
Map
Nearby Homes
- 1900 SW Cherokee Strip
- 1804 SW Cherokee Strip
- 1604 SW 18th Street Ct
- 1104 SW Mic-O-say Dr
- 1004 SW Hiawatha Dr
- 2413 SW Emerald Creek Place
- 1103 SW Stonecreek Dr
- 1201 SW Hopi St
- 2603 SW Shadow Creek Ct
- 1604 SW 21st St
- 1331 SW Horizon Dr
- 1004 SW Twilight Ln
- 2807 SW Summer Creek Ct
- 2115 S 7 Hwy
- 1008 SW 17th St
- 1001 SW 18th St
- 4805 SW 6th St
- 4809 SW 6th St
- 1311 SW 25th St
- 1901 SW Gladstone Dr
- 1901 SW 14th St
- 1913 SW 14th St
- 1912 SW Cherokee Strip
- 1908 SW Cherokee Strip
- 1916 SW Cherokee Strip
- 1817 SW 14th St
- 1321 SW Hidden Creek Ct
- 2001 SW 14th St
- 1320 SW Shawnee St
- 1904 SW Cherokee Strip
- 2000 SW Cherokee Strip
- 1320 SW Hidden Creek Ct
- 1317 SW Hidden Creek Ct
- 1813 SW 14th St
- 2101 SW 14th St
- 1316 SW Shawnee St
- 2100 SW Cherokee Strip
- 1812 SW 14th St
- 1917 SW Cherokee Strip
- 1809 SW 14th St