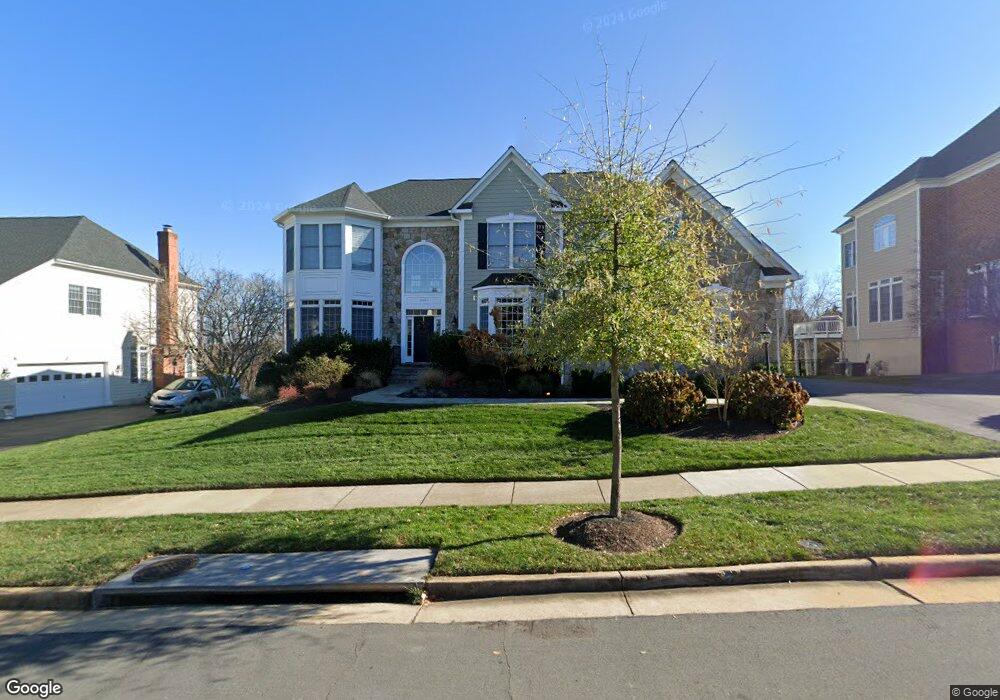
19094 Boyer Fields Place Leesburg, VA 20176
Estimated Value: $1,421,980 - $1,632,000
5
Beds
5
Baths
6,200
Sq Ft
$250/Sq Ft
Est. Value
About This Home
This home is located at 19094 Boyer Fields Place, Leesburg, VA 20176 and is currently estimated at $1,550,745, approximately $250 per square foot. 19094 Boyer Fields Place is a home located in Loudoun County with nearby schools including Steuart W. Weller Elementary School, Belmont Ridge Middle, and Riverside High.
Ownership History
Date
Name
Owned For
Owner Type
Purchase Details
Closed on
Apr 5, 2011
Sold by
Chang Phillip J
Bought by
Garvin William
Current Estimated Value
Home Financials for this Owner
Home Financials are based on the most recent Mortgage that was taken out on this home.
Original Mortgage
$708,000
Outstanding Balance
$492,772
Interest Rate
4.99%
Mortgage Type
New Conventional
Estimated Equity
$1,057,973
Purchase Details
Closed on
Sep 24, 2002
Sold by
Lansdowne Comm Developmt
Bought by
Rosenthal Chistopher R
Home Financials for this Owner
Home Financials are based on the most recent Mortgage that was taken out on this home.
Original Mortgage
$137,000
Interest Rate
6.25%
Purchase Details
Closed on
Sep 19, 2002
Sold by
Lansdowne Comm Developmt
Bought by
Chang Phillip J
Home Financials for this Owner
Home Financials are based on the most recent Mortgage that was taken out on this home.
Original Mortgage
$137,000
Interest Rate
6.25%
Create a Home Valuation Report for This Property
The Home Valuation Report is an in-depth analysis detailing your home's value as well as a comparison with similar homes in the area
Home Values in the Area
Average Home Value in this Area
Purchase History
| Date | Buyer | Sale Price | Title Company |
|---|---|---|---|
| Garvin William | $890,000 | -- | |
| Rosenthal Chistopher R | $718,245 | -- | |
| Chang Phillip J | $674,655 | -- |
Source: Public Records
Mortgage History
| Date | Status | Borrower | Loan Amount |
|---|---|---|---|
| Open | Garvin William | $708,000 | |
| Previous Owner | Rosenthal Chistopher R | $137,000 | |
| Previous Owner | Chang Phillip J | $539,700 |
Source: Public Records
Tax History Compared to Growth
Tax History
| Year | Tax Paid | Tax Assessment Tax Assessment Total Assessment is a certain percentage of the fair market value that is determined by local assessors to be the total taxable value of land and additions on the property. | Land | Improvement |
|---|---|---|---|---|
| 2025 | $11,400 | $1,416,160 | $407,500 | $1,008,660 |
| 2024 | $11,216 | $1,296,640 | $367,500 | $929,140 |
| 2023 | $10,506 | $1,200,690 | $367,500 | $833,190 |
| 2022 | $9,071 | $1,019,160 | $284,500 | $734,660 |
| 2021 | $8,596 | $877,190 | $244,500 | $632,690 |
| 2020 | $8,475 | $818,880 | $244,500 | $574,380 |
| 2019 | $8,444 | $807,990 | $244,500 | $563,490 |
| 2018 | $8,842 | $814,930 | $234,500 | $580,430 |
| 2017 | $8,889 | $790,090 | $234,500 | $555,590 |
| 2016 | $8,887 | $776,180 | $0 | $0 |
| 2015 | $8,845 | $544,770 | $0 | $544,770 |
| 2014 | $8,770 | $544,790 | $0 | $544,790 |
Source: Public Records
Map
Nearby Homes
- 19126 Stream Crossing Ct
- 19057 Amur Ct
- 43802 Lees Mill Square
- 43915 Kittiwake Dr
- 19059 Coral Reef Square
- 43919 Maritime Song Terrace
- 43899 Siren Song Terrace
- 43843 Kittiwake Dr
- 18989 Coral Reef Square
- 19296 Creek Field Cir
- 19111 Chartier Dr
- 19355 Cypress Ridge Terrace Unit 406
- 19355 Cypress Ridge Terrace Unit 509
- 19355 Cypress Ridge Terrace Unit 423
- 19365 Cypress Ridge Terrace Unit 1102
- 19121 Eagle Mine Terrace
- 19350 Magnolia Grove Square Unit 405
- 19350 Magnolia Grove Square Unit 303
- 19375 Cypress Ridge Terrace Unit 1115
- 19375 Cypress Ridge Terrace Unit 1002
- 19090 Boyer Fields Place
- 19098 Boyer Fields Place
- 19147 Stream Crossing Ct
- 19086 Boyer Fields Place
- 19095 Boyer Fields Place
- 19151 Stream Crossing Ct
- 19091 Boyer Fields Place
- 19102 Boyer Fields Place
- 19143 Stream Crossing Ct
- 19103 Boyer Fields Place
- 19155 Stream Crossing Ct
- 19087 Boyer Fields Place
- 19139 Stream Crossing Ct
- 19078 Boyer Fields Place
- 43430 Squirrel Ridge Place
- 43426 Squirrel Ridge Place
- 43434 Squirrel Ridge Place
- 19083 Boyer Fields Place
- 19082 Coton Farm Ct
- 43422 Squirrel Ridge Place