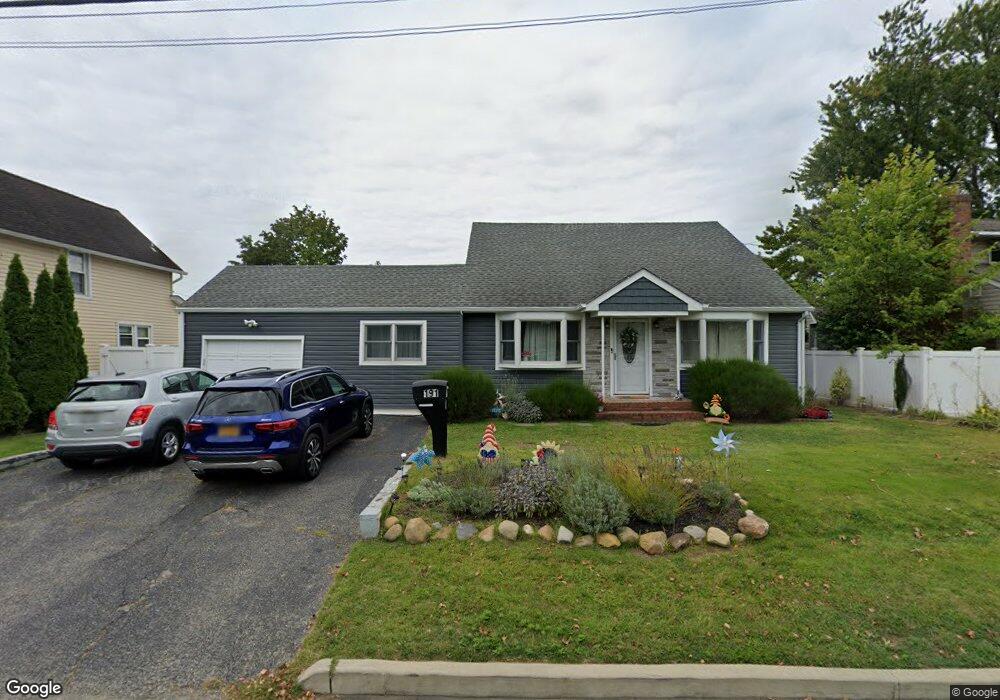
191 Albany Ave Lindenhurst, NY 11757
Estimated Value: $640,434 - $689,000
4
Beds
2
Baths
1,535
Sq Ft
$438/Sq Ft
Est. Value
About This Home
This home is located at 191 Albany Ave, Lindenhurst, NY 11757 and is currently estimated at $671,859, approximately $437 per square foot. 191 Albany Ave is a home located in Suffolk County with nearby schools including Albany Avenue Elementary School, Lindenhurst Middle School, and Lindenhurst Senior High School.
Ownership History
Date
Name
Owned For
Owner Type
Purchase Details
Closed on
Jan 8, 2019
Sold by
Sinch Rajan and Singh Anjali
Bought by
Pistone Christopher J and Schirmunly-Pstone Sarah M
Current Estimated Value
Purchase Details
Closed on
Dec 11, 2003
Sold by
Duffy James
Bought by
Singh Anjali and Singh Rajan
Home Financials for this Owner
Home Financials are based on the most recent Mortgage that was taken out on this home.
Original Mortgage
$270,750
Interest Rate
5.36%
Mortgage Type
Purchase Money Mortgage
Create a Home Valuation Report for This Property
The Home Valuation Report is an in-depth analysis detailing your home's value as well as a comparison with similar homes in the area
Home Values in the Area
Average Home Value in this Area
Purchase History
| Date | Buyer | Sale Price | Title Company |
|---|---|---|---|
| Pistone Christopher J | $379,000 | -- | |
| Singh Anjali | $285,000 | -- |
Source: Public Records
Mortgage History
| Date | Status | Borrower | Loan Amount |
|---|---|---|---|
| Previous Owner | Singh Anjali | $270,750 |
Source: Public Records
Tax History Compared to Growth
Tax History
| Year | Tax Paid | Tax Assessment Tax Assessment Total Assessment is a certain percentage of the fair market value that is determined by local assessors to be the total taxable value of land and additions on the property. | Land | Improvement |
|---|---|---|---|---|
| 2024 | $12,529 | $3,350 | $260 | $3,090 |
| 2023 | $11,215 | $3,350 | $260 | $3,090 |
| 2022 | $10,293 | $3,350 | $260 | $3,090 |
| 2021 | $10,293 | $3,350 | $260 | $3,090 |
| 2020 | $10,407 | $3,350 | $260 | $3,090 |
| 2019 | $11,497 | $0 | $0 | $0 |
| 2018 | $10,183 | $3,350 | $260 | $3,090 |
| 2017 | $10,183 | $3,350 | $260 | $3,090 |
| 2016 | $10,195 | $3,350 | $260 | $3,090 |
| 2015 | -- | $3,350 | $260 | $3,090 |
| 2014 | -- | $3,350 | $260 | $3,090 |
Source: Public Records
Map
Nearby Homes