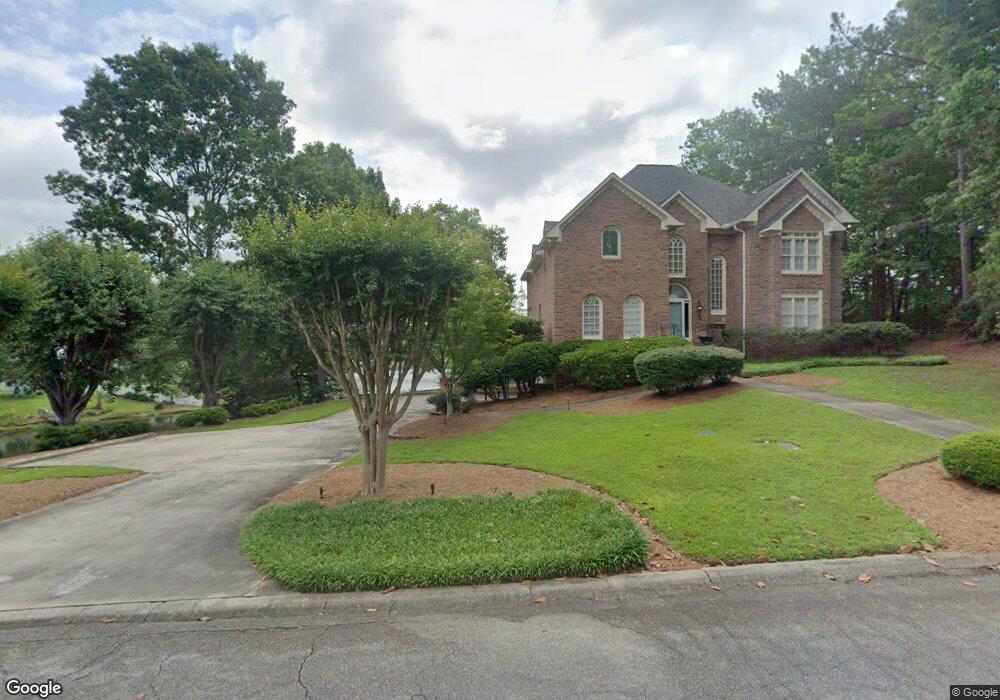
191 Carriage Way Unit 42 Macon, GA 31210
Estimated Value: $470,634 - $577,000
5
Beds
4
Baths
3,486
Sq Ft
$150/Sq Ft
Est. Value
About This Home
This home is located at 191 Carriage Way Unit 42, Macon, GA 31210 and is currently estimated at $523,409, approximately $150 per square foot. 191 Carriage Way Unit 42 is a home located in Bibb County with nearby schools including Springdale Elementary School, Howard Middle School, and Howard High School.
Ownership History
Date
Name
Owned For
Owner Type
Purchase Details
Closed on
Aug 27, 2020
Sold by
Cannon Britney M and Cannon Jason P
Bought by
Hayes Daisha L and Hayes Jackson H
Current Estimated Value
Home Financials for this Owner
Home Financials are based on the most recent Mortgage that was taken out on this home.
Original Mortgage
$323,100
Outstanding Balance
$287,256
Interest Rate
3%
Mortgage Type
New Conventional
Estimated Equity
$236,153
Purchase Details
Closed on
Mar 31, 2014
Sold by
Fellows Glen D and Fellows Linda D
Bought by
Cannon Jason P and Cannon Britney M
Home Financials for this Owner
Home Financials are based on the most recent Mortgage that was taken out on this home.
Original Mortgage
$270,750
Interest Rate
4.3%
Mortgage Type
New Conventional
Purchase Details
Closed on
Dec 17, 2002
Bought by
Fellows Glen D and Fellows Linda D
Purchase Details
Closed on
Dec 22, 2000
Create a Home Valuation Report for This Property
The Home Valuation Report is an in-depth analysis detailing your home's value as well as a comparison with similar homes in the area
Home Values in the Area
Average Home Value in this Area
Purchase History
| Date | Buyer | Sale Price | Title Company |
|---|---|---|---|
| Hayes Daisha L | $359,000 | None Available | |
| Cannon Jason P | $285,000 | None Available | |
| Fellows Glen D | $330,000 | -- | |
| -- | $298,000 | -- |
Source: Public Records
Mortgage History
| Date | Status | Borrower | Loan Amount |
|---|---|---|---|
| Open | Hayes Daisha L | $323,100 | |
| Previous Owner | Cannon Jason P | $270,750 |
Source: Public Records
Tax History Compared to Growth
Tax History
| Year | Tax Paid | Tax Assessment Tax Assessment Total Assessment is a certain percentage of the fair market value that is determined by local assessors to be the total taxable value of land and additions on the property. | Land | Improvement |
|---|---|---|---|---|
| 2024 | $4,217 | $173,042 | $30,000 | $143,042 |
| 2023 | $3,760 | $173,042 | $30,000 | $143,042 |
| 2022 | $5,195 | $157,067 | $37,080 | $119,987 |
| 2021 | $5,086 | $140,855 | $34,200 | $106,655 |
| 2020 | $5,067 | $137,522 | $34,200 | $103,322 |
| 2019 | $4,838 | $130,589 | $30,600 | $99,989 |
| 2018 | $7,589 | $130,589 | $30,600 | $99,989 |
| 2017 | $4,630 | $130,589 | $30,600 | $99,989 |
| 2016 | $4,084 | $125,034 | $30,600 | $94,434 |
| 2015 | $5,240 | $125,034 | $30,600 | $94,434 |
| 2014 | $5,755 | $124,328 | $30,600 | $93,728 |
Source: Public Records
Map
Nearby Homes
- 191 Carriage Way
- 501 Rivoli Vista
- 501 Rivoli Vista Unit 41
- 505 Rivoli Vista
- 505 Rivoli Vista Unit 280
- 186 Carriage Way
- 134 Lake View Dr N
- 138 Lake View Dr N
- 182 Carriage Way
- 130 Lake View Dr N
- 509 Rivoli Vista
- 183 Carriage Way
- 142 Lake View Dr N
- 128 Lake View Dr N
- 178 Carriage Way
- 504 Rivoli Vista
- 0 Lake View Dr N Unit 7300062
- 0 Lake View Dr N Unit 3018910
- 213 Hunters Hill Ct
- 124 Lake View Dr N