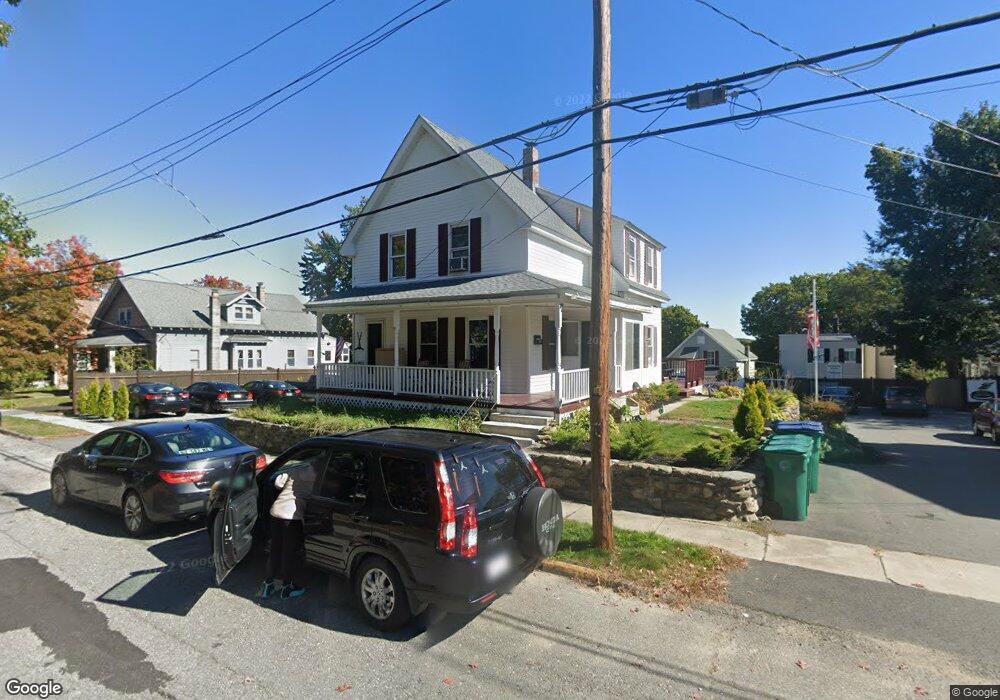
191 Cedar St Fitchburg, MA 01420
Estimated Value: $287,000 - $374,770
3
Beds
2
Baths
1,302
Sq Ft
$261/Sq Ft
Est. Value
About This Home
This home is located at 191 Cedar St, Fitchburg, MA 01420 and is currently estimated at $339,943, approximately $261 per square foot. 191 Cedar St is a home located in Worcester County with nearby schools including South Street Elementary School, Crocker Elementary School, and Fitchburg High School.
Ownership History
Date
Name
Owned For
Owner Type
Purchase Details
Closed on
May 8, 2024
Sold by
Fbc 19-62 Llc
Bought by
Fbc 19-62 Inc
Current Estimated Value
Purchase Details
Closed on
Feb 27, 2017
Sold by
Buckley Eric S and Wells Fargo Bank Na
Bought by
Wells Fargo Bank Na
Purchase Details
Closed on
Jun 25, 2004
Sold by
Leblanc Paula A
Bought by
Buckley Eric S and Buckley Michelle E
Home Financials for this Owner
Home Financials are based on the most recent Mortgage that was taken out on this home.
Original Mortgage
$186,966
Interest Rate
6.32%
Mortgage Type
Purchase Money Mortgage
Create a Home Valuation Report for This Property
The Home Valuation Report is an in-depth analysis detailing your home's value as well as a comparison with similar homes in the area
Home Values in the Area
Average Home Value in this Area
Purchase History
| Date | Buyer | Sale Price | Title Company |
|---|---|---|---|
| Fbc 19-62 Inc | -- | None Available | |
| Fbc 19-62 Inc | -- | None Available | |
| Wells Fargo Bank Na | $103,320 | -- | |
| Buckley Eric S | $189,900 | -- | |
| Wells Fargo Bank Na | $103,320 | -- | |
| Buckley Eric S | $189,900 | -- |
Source: Public Records
Mortgage History
| Date | Status | Borrower | Loan Amount |
|---|---|---|---|
| Previous Owner | Buckley Eric S | $173,920 | |
| Previous Owner | Buckley Eric S | $186,966 |
Source: Public Records
Tax History Compared to Growth
Tax History
| Year | Tax Paid | Tax Assessment Tax Assessment Total Assessment is a certain percentage of the fair market value that is determined by local assessors to be the total taxable value of land and additions on the property. | Land | Improvement |
|---|---|---|---|---|
| 2025 | $44 | $322,300 | $99,300 | $223,000 |
| 2024 | $4,148 | $280,100 | $63,800 | $216,300 |
| 2023 | $4,136 | $258,200 | $54,800 | $203,400 |
| 2022 | $4,020 | $228,300 | $45,900 | $182,400 |
| 2021 | $3,766 | $197,900 | $33,200 | $164,700 |
| 2020 | $4,130 | $185,600 | $30,600 | $155,000 |
| 2019 | $7,906 | $163,900 | $43,400 | $120,500 |
| 2018 | $2,981 | $141,900 | $40,800 | $101,100 |
| 2017 | $2,841 | $132,200 | $40,800 | $91,400 |
| 2016 | $2,703 | $127,300 | $37,000 | $90,300 |
| 2015 | $2,573 | $124,400 | $35,700 | $88,700 |
| 2014 | $2,467 | $124,400 | $35,700 | $88,700 |
Source: Public Records
Map
Nearby Homes
- 855 John Fitch Hwy Unit 44
- 288-290 Pearl St
- 206 Highland Ave
- 137 East St
- 94 Fitch Hill Ave
- 56 Orange St
- 62 Wendell Rd
- 168 Lunenburg St
- 1 Avon Place
- 23 Marshall Rd
- 208 Blossom St
- 4 Brigham Park
- 0 Townsend St
- 29 Brigham Park
- 15-25 Lunenburg St
- 85 Boutelle St
- 34 Garnet St
- 5 Jay St
- 36 Jackson Ave
- 29 Mount Vernon St