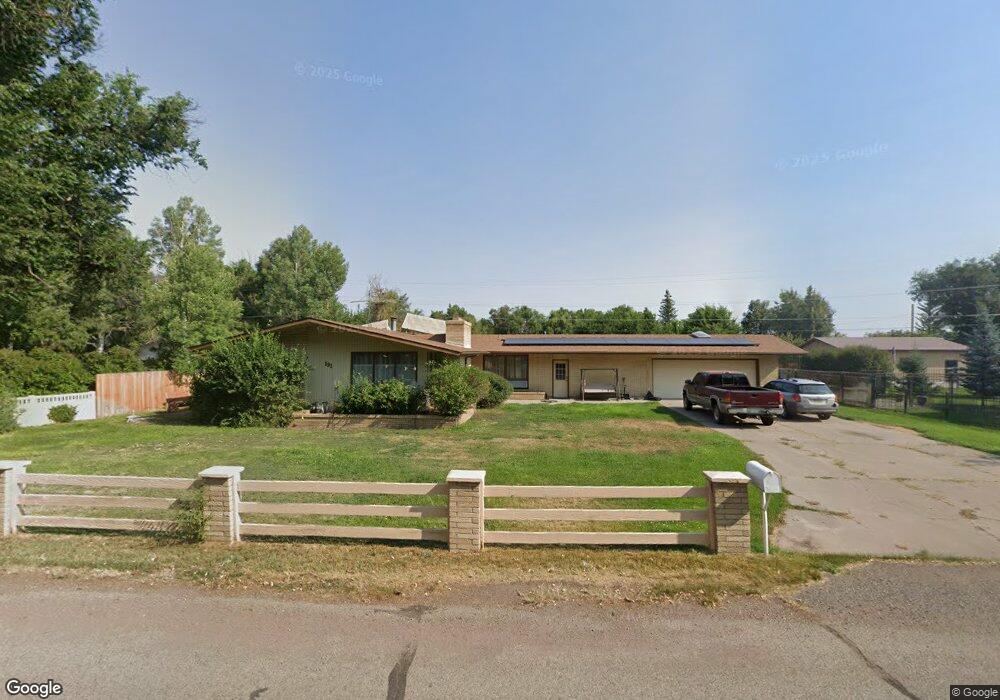
191 Curtis Ln Alamosa, CO 81101
Estimated Value: $314,000 - $398,000
3
Beds
2
Baths
2,245
Sq Ft
$161/Sq Ft
Est. Value
About This Home
This home is located at 191 Curtis Ln, Alamosa, CO 81101 and is currently estimated at $360,478, approximately $160 per square foot. 191 Curtis Ln is a home located in Alamosa County with nearby schools including Alamosa Elementary School, Ortega Middle School, and Alamosa High School.
Ownership History
Date
Name
Owned For
Owner Type
Purchase Details
Closed on
Feb 28, 2020
Sold by
A & P Investments Llc
Bought by
Garcia Gilbert J and Garcia Ruth K
Current Estimated Value
Home Financials for this Owner
Home Financials are based on the most recent Mortgage that was taken out on this home.
Original Mortgage
$189,200
Outstanding Balance
$131,324
Interest Rate
3.6%
Mortgage Type
Commercial
Estimated Equity
$229,154
Purchase Details
Closed on
Jul 23, 2019
Sold by
Zietz Zietz Iii Carl H Iii Carl H and Zietz Carl Hugo
Bought by
A & P Investments Llc
Home Financials for this Owner
Home Financials are based on the most recent Mortgage that was taken out on this home.
Original Mortgage
$136,000
Interest Rate
3.82%
Mortgage Type
Purchase Money Mortgage
Purchase Details
Closed on
Apr 12, 1989
Sold by
Zietz Carl H
Bought by
Zietz Carl H
Purchase Details
Closed on
Sep 8, 1969
Bought by
Zietz Carl
Create a Home Valuation Report for This Property
The Home Valuation Report is an in-depth analysis detailing your home's value as well as a comparison with similar homes in the area
Home Values in the Area
Average Home Value in this Area
Purchase History
| Date | Buyer | Sale Price | Title Company |
|---|---|---|---|
| Garcia Gilbert J | $236,500 | None Available | |
| A & P Investments Llc | $201,008 | None Available | |
| Zietz Carl H | -- | -- | |
| Zietz Carl | $32,000 | -- |
Source: Public Records
Mortgage History
| Date | Status | Borrower | Loan Amount |
|---|---|---|---|
| Open | Garcia Gilbert J | $189,200 | |
| Previous Owner | A & P Investments Llc | $136,000 |
Source: Public Records
Tax History Compared to Growth
Tax History
| Year | Tax Paid | Tax Assessment Tax Assessment Total Assessment is a certain percentage of the fair market value that is determined by local assessors to be the total taxable value of land and additions on the property. | Land | Improvement |
|---|---|---|---|---|
| 2024 | $1,177 | $18,371 | $670 | $17,701 |
| 2023 | $1,205 | $18,550 | $677 | $17,873 |
| 2022 | $1,367 | $16,473 | $536 | $15,937 |
| 2021 | $1,405 | $16,473 | $536 | $15,937 |
| 2020 | $1,177 | $16,473 | $536 | $15,937 |
| 2019 | $1,181 | $13,576 | $358 | $13,218 |
| 2018 | $586 | $13,269 | $360 | $12,909 |
| 2017 | $587 | $13,269 | $360 | $12,909 |
| 2016 | $568 | $12,894 | $398 | $12,496 |
| 2015 | $1,136 | $12,894 | $398 | $12,496 |
| 2014 | -- | $12,747 | $398 | $12,349 |
| 2013 | -- | $12,747 | $398 | $12,349 |
Source: Public Records
Map
Nearby Homes
- 295 Sunnyside Ln
- 309 Sunnyside Ln
- 0 McKinney White Pine Unit REC1813333
- TBD County Road 6 S
- 1018 State St
- 5895 State Highway 17
- 00 E Us Highway 160
- 61 Conejos Ave
- 12 Rio Grande Ave
- 6755 Trinchera Ln
- 631 2nd St
- 735 First St
- 6 Mountain View Place
- 0 Mountain View Blvd Unit 23881373
- 6 Bellwood Dr
- Lot 14 Fourth St
- 24 Alamosa Ave
- 711 Cottonwood Cir
- 302 Bell Ave
- 1623-B 6th St
- 0 Curtis Ln
- 201 Curtis Ln
- 221 Curtis Ln
- 200 Sunnyside Ln
- 180 Curtis Ln
- 190 Curtis Ln
- 171 Curtis Ln
- 138 Sunnyside Ln
- 170 Curtis Ln
- 0 Sunnyside Ln Unit 742697
- 0 Sunnyside Ln Unit 599398
- 0 Sunnyside Ln Unit 624072
- 0 Sunnyside Ln Unit 637523
- 0 Sunnyside Ln Unit 652964
- 0 Sunnyside Ln Unit 668938
- 0 Sunnyside Ln Unit 669402
- 0 Sunnyside Ln Unit 684991
- 0 Sunnyside Ln Unit 685495
- 0 Sunnyside Ln Unit 687108
- 0 Sunnyside Ln Unit 702627