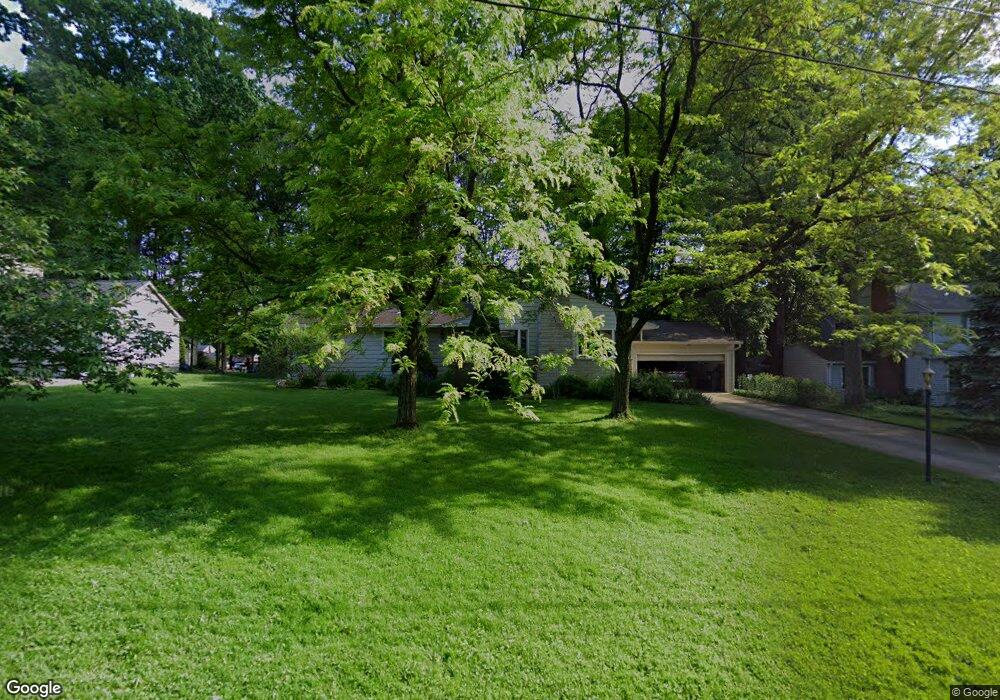
191 Dartmouth Dr Canfield, OH 44406
Estimated Value: $240,000 - $275,000
3
Beds
3
Baths
1,452
Sq Ft
$180/Sq Ft
Est. Value
About This Home
This home is located at 191 Dartmouth Dr, Canfield, OH 44406 and is currently estimated at $260,766, approximately $179 per square foot. 191 Dartmouth Dr is a home located in Mahoning County with nearby schools including Canfield Village Middle School and Canfield High School.
Ownership History
Date
Name
Owned For
Owner Type
Purchase Details
Closed on
Aug 10, 2004
Sold by
Jones Wendell L and Jones Joan M
Bought by
Mcgarry Colleen
Current Estimated Value
Home Financials for this Owner
Home Financials are based on the most recent Mortgage that was taken out on this home.
Original Mortgage
$47,000
Interest Rate
5.75%
Mortgage Type
Purchase Money Mortgage
Purchase Details
Closed on
Aug 4, 2000
Sold by
Cindlee Corp
Bought by
Jones Wendell L
Home Financials for this Owner
Home Financials are based on the most recent Mortgage that was taken out on this home.
Original Mortgage
$80,000
Interest Rate
8.19%
Purchase Details
Closed on
Aug 22, 1997
Sold by
Breunig Bruce J and Breunig Carol A
Bought by
Cindlee Corp
Purchase Details
Closed on
Apr 14, 1983
Bought by
Breunig Bruce J and Breunig Carol A
Create a Home Valuation Report for This Property
The Home Valuation Report is an in-depth analysis detailing your home's value as well as a comparison with similar homes in the area
Home Values in the Area
Average Home Value in this Area
Purchase History
| Date | Buyer | Sale Price | Title Company |
|---|---|---|---|
| Mcgarry Colleen | $142,000 | -- | |
| Jones Wendell L | $129,700 | -- | |
| Cindlee Corp | $105,000 | -- | |
| Breunig Bruce J | -- | -- |
Source: Public Records
Mortgage History
| Date | Status | Borrower | Loan Amount |
|---|---|---|---|
| Closed | Mcgarry Colleen | $47,000 | |
| Previous Owner | Jones Wendell L | $80,000 |
Source: Public Records
Tax History Compared to Growth
Tax History
| Year | Tax Paid | Tax Assessment Tax Assessment Total Assessment is a certain percentage of the fair market value that is determined by local assessors to be the total taxable value of land and additions on the property. | Land | Improvement |
|---|---|---|---|---|
| 2024 | $3,232 | $73,440 | $12,920 | $60,520 |
| 2023 | $3,182 | $73,440 | $12,920 | $60,520 |
| 2022 | $2,531 | $46,500 | $11,840 | $34,660 |
| 2021 | $2,458 | $46,500 | $11,840 | $34,660 |
| 2020 | $2,468 | $46,500 | $11,840 | $34,660 |
| 2019 | $2,396 | $40,970 | $11,840 | $29,130 |
| 2018 | $2,368 | $40,970 | $11,840 | $29,130 |
| 2017 | $2,365 | $40,970 | $11,840 | $29,130 |
| 2016 | $2,158 | $38,030 | $10,550 | $27,480 |
| 2015 | $2,112 | $38,030 | $10,550 | $27,480 |
| 2014 | $2,121 | $38,030 | $10,550 | $27,480 |
| 2013 | $2,047 | $38,030 | $10,550 | $27,480 |
Source: Public Records
Map
Nearby Homes
- 58 Skyline Dr
- 38 Skyline Dr
- 78 Neff Dr
- 395 N Broad St
- 125 Callahan Rd
- 321 Hilltop Blvd
- 9 Willow Way
- 21 Villa Theresa Ln
- 10 Villa Theresa Ln
- 31 Villa Theresa Ln
- 20 Villa Theresa Ln
- 30 Villa Theresa Ln
- 201 Talsman Dr Unit 1
- 211 Talsman Dr Unit 1
- 90 Villa Theresa Ln
- 120 Talsman Dr Unit 4
- 100 Talsman Dr
- 6020 Century Blvd
- 225 Sleepy Hollow Dr
- 0 Shields Rd Unit 5162190
- 181 Dartmouth Dr
- 201 Dartmouth Dr
- 190 Chapel Ln
- 211 Dartmouth Dr
- 171 Dartmouth Dr
- 200 Chapel Ln
- 180 Chapel Ln
- 200 Dartmouth Dr
- 190 Dartmouth Dr
- 210 Chapel Ln
- 170 Chapel Ln
- 161 Dartmouth Dr
- 221 Dartmouth Dr
- 180 Dartmouth Dr
- 210 Dartmouth Dr
- 160 Chapel Ln
- 220 Chapel Ln
- 220 Dartmouth Dr
- 231 Dartmouth Dr
- 151 Dartmouth Dr