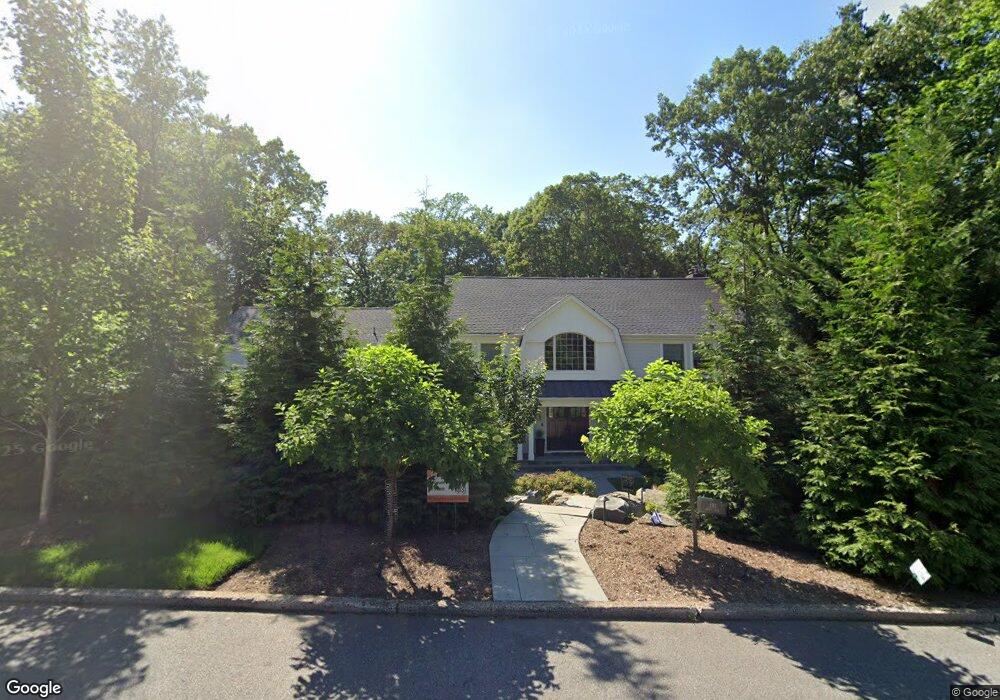
191 Devon Rd Tenafly, NJ 07670
Estimated Value: $2,432,000 - $3,016,000
Studio
--
Bath
4,622
Sq Ft
$592/Sq Ft
Est. Value
About This Home
This home is located at 191 Devon Rd, Tenafly, NJ 07670 and is currently estimated at $2,736,653, approximately $592 per square foot. 191 Devon Rd is a home located in Bergen County with nearby schools including Tenafly Middle School, Tenafly High School, and The Elisabeth Morrow School.
Ownership History
Date
Name
Owned For
Owner Type
Purchase Details
Closed on
Oct 13, 2016
Sold by
D And H Real Estate Holdings Lc
Bought by
Farkas Jordan and Farkas Lauren
Current Estimated Value
Home Financials for this Owner
Home Financials are based on the most recent Mortgage that was taken out on this home.
Original Mortgage
$1,120,000
Outstanding Balance
$898,459
Interest Rate
3.48%
Mortgage Type
New Conventional
Estimated Equity
$1,838,194
Purchase Details
Closed on
Sep 19, 2012
Sold by
Jeffrey Hope H
Bought by
D And H Real Estate Holdings Llc
Purchase Details
Closed on
Aug 16, 2007
Sold by
Jeffrey David L K and Jeffrey Hope H
Bought by
Jeffrey Hope H
Create a Home Valuation Report for This Property
The Home Valuation Report is an in-depth analysis detailing your home's value as well as a comparison with similar homes in the area
Home Values in the Area
Average Home Value in this Area
Purchase History
| Date | Buyer | Sale Price | Title Company |
|---|---|---|---|
| Farkas Jordan | $1,400,000 | Title Insurance Commitment | |
| D And H Real Estate Holdings Llc | -- | -- | |
| Jeffrey Hope H | -- | -- |
Source: Public Records
Mortgage History
| Date | Status | Borrower | Loan Amount |
|---|---|---|---|
| Open | Farkas Jordan | $1,120,000 |
Source: Public Records
Tax History
| Year | Tax Paid | Tax Assessment Tax Assessment Total Assessment is a certain percentage of the fair market value that is determined by local assessors to be the total taxable value of land and additions on the property. | Land | Improvement |
|---|---|---|---|---|
| 2025 | $45,456 | $1,560,000 | $1,087,400 | $472,600 |
| 2024 | $44,352 | $1,600,000 | $1,087,400 | $512,600 |
| 2023 | $43,280 | $1,600,000 | $1,087,400 | $512,600 |
| 2022 | $43,280 | $1,600,000 | $1,087,400 | $512,600 |
| 2021 | $46,255 | $1,600,000 | $1,087,400 | $512,600 |
| 2020 | $47,082 | $1,798,400 | $1,087,400 | $711,000 |
| 2019 | $46,255 | $1,798,400 | $1,087,400 | $711,000 |
| 2018 | $36,329 | $1,434,800 | $1,087,400 | $347,400 |
| 2017 | $40,615 | $1,609,800 | $1,087,400 | $522,400 |
| 2016 | $39,810 | $1,609,800 | $1,087,400 | $522,400 |
| 2015 | $38,925 | $1,609,800 | $1,087,400 | $522,400 |
| 2014 | $38,201 | $1,609,800 | $1,087,400 | $522,400 |
Source: Public Records
Map
Nearby Homes
Your Personal Tour Guide
Ask me questions while you tour the home.