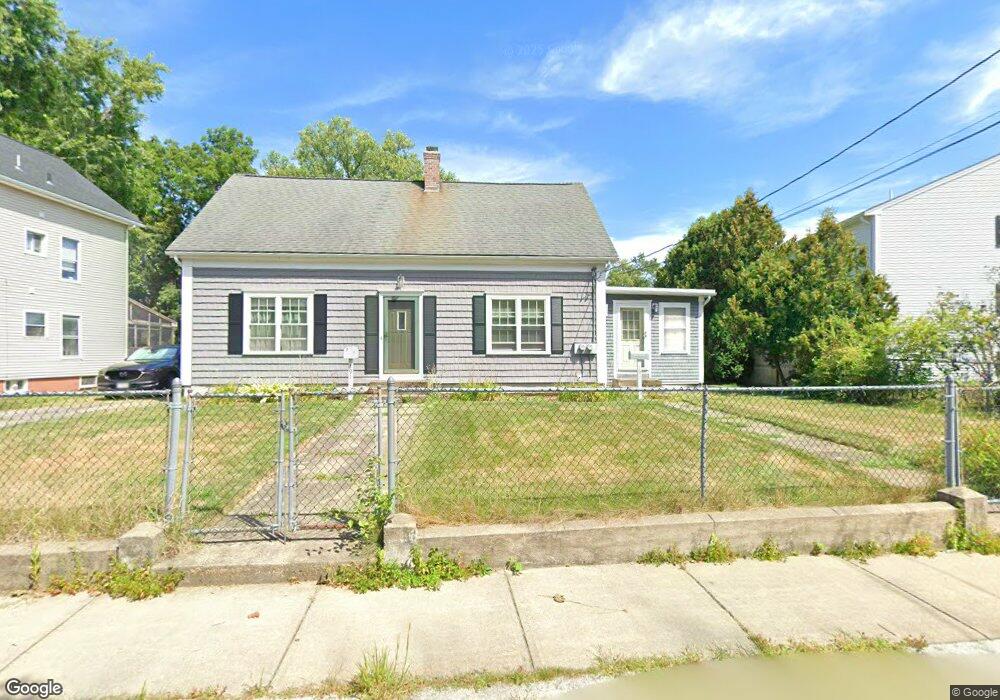
191 East St North Attleboro, MA 02760
North Attleboro NeighborhoodEstimated Value: $610,000 - $708,551
4
Beds
2
Baths
2,256
Sq Ft
$292/Sq Ft
Est. Value
About This Home
This home is located at 191 East St, North Attleboro, MA 02760 and is currently estimated at $659,388, approximately $292 per square foot. 191 East St is a home located in Bristol County with nearby schools including North Attleboro High School.
Ownership History
Date
Name
Owned For
Owner Type
Purchase Details
Closed on
Apr 12, 2018
Sold by
Meyers David B
Bought by
Meyers David B and Small Stephen W
Current Estimated Value
Purchase Details
Closed on
May 8, 2007
Sold by
Meyers David B and Woolverton Mark L
Bought by
Meyers David B
Home Financials for this Owner
Home Financials are based on the most recent Mortgage that was taken out on this home.
Original Mortgage
$80,000
Interest Rate
6.23%
Purchase Details
Closed on
Jul 23, 1987
Sold by
St Jean Barbara J
Bought by
Meyers David B
Home Financials for this Owner
Home Financials are based on the most recent Mortgage that was taken out on this home.
Original Mortgage
$133,900
Interest Rate
10.67%
Mortgage Type
Purchase Money Mortgage
Create a Home Valuation Report for This Property
The Home Valuation Report is an in-depth analysis detailing your home's value as well as a comparison with similar homes in the area
Home Values in the Area
Average Home Value in this Area
Purchase History
| Date | Buyer | Sale Price | Title Company |
|---|---|---|---|
| Meyers David B | -- | -- | |
| Meyers David B | -- | -- | |
| Meyers David B | $150,000 | -- |
Source: Public Records
Mortgage History
| Date | Status | Borrower | Loan Amount |
|---|---|---|---|
| Previous Owner | Meyers David B | $80,000 | |
| Previous Owner | Meyers David B | $117,900 | |
| Previous Owner | Meyers David B | $133,900 |
Source: Public Records
Tax History Compared to Growth
Tax History
| Year | Tax Paid | Tax Assessment Tax Assessment Total Assessment is a certain percentage of the fair market value that is determined by local assessors to be the total taxable value of land and additions on the property. | Land | Improvement |
|---|---|---|---|---|
| 2025 | $6,183 | $524,400 | $128,800 | $395,600 |
| 2024 | $5,921 | $513,100 | $128,800 | $384,300 |
| 2023 | $5,597 | $437,600 | $128,800 | $308,800 |
| 2022 | $5,796 | $416,100 | $122,400 | $293,700 |
| 2021 | $5,494 | $385,000 | $115,900 | $269,100 |
| 2020 | $4,773 | $332,600 | $109,500 | $223,100 |
| 2019 | $4,594 | $322,600 | $99,500 | $223,100 |
| 2018 | $3,612 | $270,800 | $93,700 | $177,100 |
| 2017 | $3,502 | $264,900 | $87,800 | $177,100 |
| 2016 | $3,219 | $243,500 | $117,000 | $126,500 |
| 2015 | $3,200 | $243,500 | $117,000 | $126,500 |
| 2014 | $3,282 | $247,900 | $109,800 | $138,100 |
Source: Public Records
Map
Nearby Homes
- 68 Fisher St
- 188 Smith St
- 19 Church St Unit A5
- 8 Al Pace Dr Unit 8
- 64 Smith St
- 16 Richards Ave Unit 106
- 880 Landry Ave Unit 2
- 0 Landry 2nd Unit 73350867
- 20 South St
- 32 Richards Ave
- 212 Fisher St Unit A5
- 42 2nd Ave Unit 24
- 217 Fisher St
- 85 Richards Ave
- 93 Bank St
- 20 Holbrook Ave
- 35-R Whiting St
- 58 Jay St
- 45 Moran St
- 1066 Mount Hope St
- 42 Fisher St
- 42 Fisher St Unit 3
- 42 Fisher St Unit 8
- 42 Fisher St Unit 10
- 42 Fisher St Unit 4
- 42 Fisher St Unit 12
- 42 Fisher St Unit 11
- 42 Fisher St Unit 1
- 42 Fisher St Unit 7
- 42 Fisher St Unit 9
- 42 Fisher St Unit STEET
- 42 Fisher St
- 42 Fisher St Unit 6
- 42 Fisher St Unit 5
- 42 Fisher St Unit 2
- 195 East St
- 201 East St
- 190 East St Unit 1
- 26 Fisher St Unit B
- 26 Fisher St Unit 1