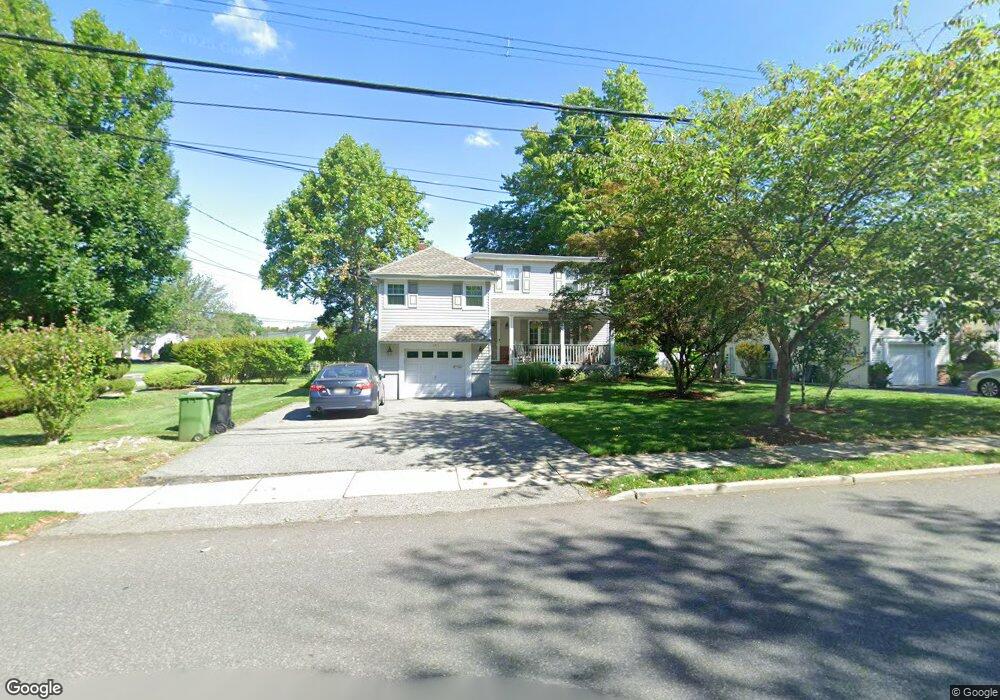
191 Howland Ave Paramus, NJ 07652
Estimated Value: $816,000 - $988,000
--
Bed
--
Bath
1,868
Sq Ft
$480/Sq Ft
Est. Value
About This Home
This home is located at 191 Howland Ave, Paramus, NJ 07652 and is currently estimated at $896,132, approximately $479 per square foot. 191 Howland Ave is a home located in Bergen County with nearby schools including Paramus High School, Ben Porat Yosef, and St. Peter Academy.
Ownership History
Date
Name
Owned For
Owner Type
Purchase Details
Closed on
Mar 20, 2025
Sold by
Pesa Linda S
Bought by
Linda S Pesa 2025 Irrevocable Trust and Depalma
Current Estimated Value
Purchase Details
Closed on
Mar 12, 2003
Sold by
Buscemi Linda S
Bought by
Pesa Linda S
Home Financials for this Owner
Home Financials are based on the most recent Mortgage that was taken out on this home.
Original Mortgage
$132,400
Interest Rate
5.9%
Purchase Details
Closed on
May 30, 2002
Sold by
Hagen Paul V
Bought by
Buscemi Linda S
Home Financials for this Owner
Home Financials are based on the most recent Mortgage that was taken out on this home.
Original Mortgage
$135,000
Interest Rate
7%
Create a Home Valuation Report for This Property
The Home Valuation Report is an in-depth analysis detailing your home's value as well as a comparison with similar homes in the area
Home Values in the Area
Average Home Value in this Area
Purchase History
| Date | Buyer | Sale Price | Title Company |
|---|---|---|---|
| Linda S Pesa 2025 Irrevocable Trust | -- | None Listed On Document | |
| Linda S Pesa 2025 Irrevocable Trust | -- | None Listed On Document | |
| Pesa Linda S | -- | -- | |
| Buscemi Linda S | $399,900 | -- |
Source: Public Records
Mortgage History
| Date | Status | Borrower | Loan Amount |
|---|---|---|---|
| Previous Owner | Pesa Linda S | $132,400 | |
| Previous Owner | Buscemi Linda S | $135,000 |
Source: Public Records
Tax History Compared to Growth
Tax History
| Year | Tax Paid | Tax Assessment Tax Assessment Total Assessment is a certain percentage of the fair market value that is determined by local assessors to be the total taxable value of land and additions on the property. | Land | Improvement |
|---|---|---|---|---|
| 2025 | $8,115 | $571,100 | $331,000 | $240,100 |
| 2024 | $7,869 | $536,000 | $306,800 | $229,200 |
| 2023 | $7,229 | $513,000 | $291,400 | $221,600 |
| 2022 | $7,479 | $481,900 | $272,700 | $209,200 |
| 2021 | $7,089 | $443,700 | $250,700 | $193,000 |
| 2020 | $6,755 | $423,500 | $232,700 | $190,800 |
| 2019 | $7,366 | $396,900 | $225,500 | $171,400 |
| 2018 | $7,275 | $396,900 | $225,500 | $171,400 |
| 2017 | $7,148 | $396,900 | $225,500 | $171,400 |
| 2016 | $6,954 | $396,900 | $225,500 | $171,400 |
| 2015 | $6,632 | $396,900 | $225,500 | $171,400 |
| 2014 | $6,573 | $396,900 | $225,500 | $171,400 |
Source: Public Records
Map
Nearby Homes
- 122 Village Cir E
- 150 Village Cir E
- 56 Lilac Ln
- 187 Crest Dr
- 187 Brookfield Ave
- 189 Forest Ave Unit 409
- 189 Forest Ave Unit 303
- 81 Eastbrook Dr
- 1 Sipporta Ln
- 104 Trinity Ct
- 29 Millar Ct
- 302 Howland Ave
- 16 Coles Ct
- 192 Valley Rd
- 4 Schubert Ln
- 6 Schubert Ln
- 215 Kensington Rd
- 212 Lozier Terrace
- 276 Greenway Terrace
- 895 Spring Valley Rd
- 195 Howland Ave
- 114 Village Cir E
- 111 Village Cir W
- 199 Howland Ave
- 115 Village Cir W
- 92 Andrea Ct
- 118 Village Cir E
- 117 Village Cir W
- 194 Howland Ave
- 225 Filippe Ct
- 181 Howland Ave
- 224 Filippe Ct
- 90 Andrea Ct
- 203 Howland Ave
- 202 Howland Ave
- 122 Village Cir W
- 91 Andrea Ct
- 121 Village Cir W
- 220 Filippe Ct
- 221 Filippe Ct