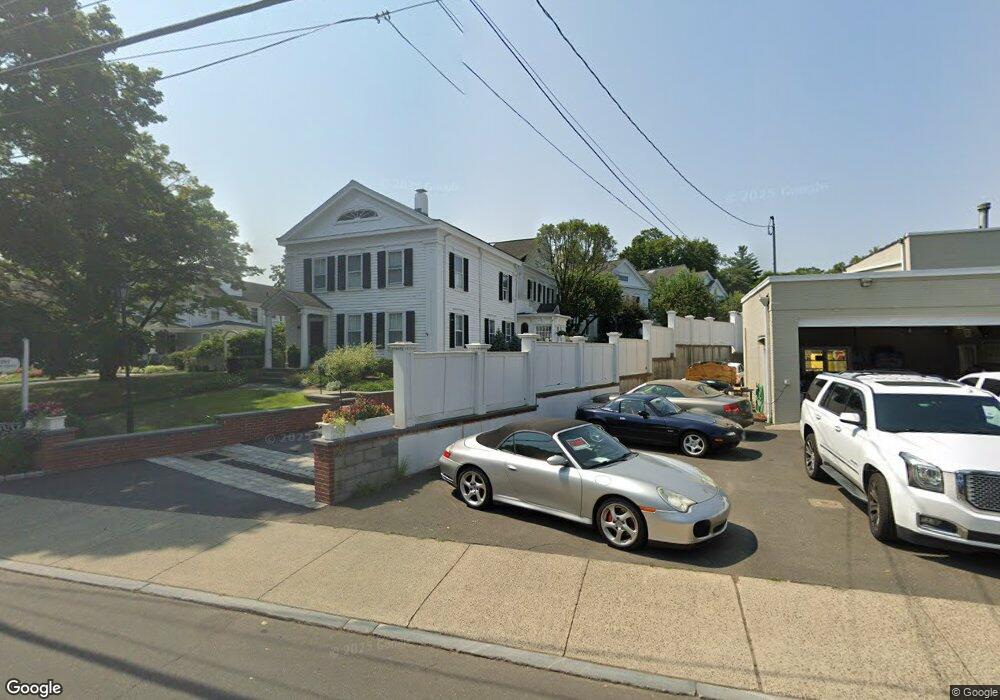
191 Main St Unit 2 New Canaan, CT 06840
Estimated Value: $1,540,000 - $2,313,000
3
Beds
3
Baths
2,442
Sq Ft
$801/Sq Ft
Est. Value
About This Home
This home is located at 191 Main St Unit 2, New Canaan, CT 06840 and is currently estimated at $1,956,260, approximately $801 per square foot. 191 Main St Unit 2 is a home located in Fairfield County with nearby schools including South Elementary School, Saxe Middle School, and New Canaan High School.
Ownership History
Date
Name
Owned For
Owner Type
Purchase Details
Closed on
Jan 2, 2025
Sold by
Ufkes Christine E
Bought by
Leibowitz Dennis
Current Estimated Value
Purchase Details
Closed on
Oct 24, 2022
Sold by
Johnson Karen Emiry Est and Roy
Bought by
Ufkes Christine E
Purchase Details
Closed on
Mar 26, 2007
Sold by
Dance Jamie G
Bought by
Dance Jamie G
Purchase Details
Closed on
Aug 17, 2004
Sold by
Fincl Cendant Mobility
Bought by
Dance Jamie G
Purchase Details
Closed on
Dec 29, 1999
Sold by
Leonhard Tr Anne S
Bought by
Hyle Charles S and Hyle Charlene K
Home Financials for this Owner
Home Financials are based on the most recent Mortgage that was taken out on this home.
Original Mortgage
$760,500
Interest Rate
6.88%
Purchase Details
Closed on
Jan 29, 1992
Sold by
Selman Douglas and Selman Jo
Bought by
Leonhardt Tr Anne
Create a Home Valuation Report for This Property
The Home Valuation Report is an in-depth analysis detailing your home's value as well as a comparison with similar homes in the area
Home Values in the Area
Average Home Value in this Area
Purchase History
| Date | Buyer | Sale Price | Title Company |
|---|---|---|---|
| Leibowitz Dennis | $2,100,000 | None Available | |
| Leibowitz Dennis | $2,100,000 | None Available | |
| Ufkes Christine E | $1,400,000 | None Available | |
| Ufkes Christine E | $1,400,000 | None Available | |
| Dance Jamie G | -- | -- | |
| Dance Jamie G | -- | -- | |
| Dance Jamie G | $1,295,000 | -- | |
| Fincl Cendant Mobility | $1,295,000 | -- | |
| Cendant Mobility Fincl | $1,295,000 | -- | |
| Hyle Charles S | $845,000 | -- | |
| Hyle Charles S | $845,000 | -- | |
| Leonhardt Tr Anne | $625,000 | -- |
Source: Public Records
Mortgage History
| Date | Status | Borrower | Loan Amount |
|---|---|---|---|
| Previous Owner | Leonhardt Tr Anne | $760,500 |
Source: Public Records
Tax History Compared to Growth
Tax History
| Year | Tax Paid | Tax Assessment Tax Assessment Total Assessment is a certain percentage of the fair market value that is determined by local assessors to be the total taxable value of land and additions on the property. | Land | Improvement |
|---|---|---|---|---|
| 2025 | $15,624 | $936,110 | $0 | $936,110 |
| 2024 | $15,109 | $936,110 | $0 | $936,110 |
| 2023 | $14,088 | $743,820 | $0 | $743,820 |
| 2022 | $13,664 | $743,820 | $0 | $743,820 |
| 2021 | $13,508 | $743,820 | $0 | $743,820 |
| 2020 | $13,508 | $743,820 | $0 | $743,820 |
| 2019 | $13,567 | $743,820 | $0 | $743,820 |
| 2018 | $13,045 | $740,880 | $0 | $740,880 |
| 2017 | $12,809 | $740,880 | $0 | $740,880 |
| 2016 | $12,518 | $740,880 | $0 | $740,880 |
| 2015 | $12,270 | $740,880 | $0 | $740,880 |
| 2014 | $11,929 | $740,880 | $0 | $740,880 |
Source: Public Records
Map
Nearby Homes
- 136 South Ave
- 15 Burtis Ave Unit Townhome D
- 15 Burtis Ave Unit West Penthouse B
- 15 Burtis Ave Unit East Penthouse C
- 15 Burtis Ave Unit Townhome A
- 15 Burtis Ave Unit East Plaza 203
- 197 Park St Unit 13
- 60 East Ave
- 64 East Ave
- 180 Summer St
- 50 Harrison Ave
- 42 Forest St Unit A
- 79 Locust Ave Unit 212
- 317 Park St
- 289 New Norwalk Rd Unit 22
- 31 Selleck Place
- 354 South Ave
- 38 Fitch Ln
- 25 Gower Rd
- 145 River St
- 191 Main St Unit 5
- 191 Main St Unit 4
- 191 Main St Unit 3
- 191 Main St Unit 1
- 191 Main St
- 190 Main St
- 222 Main St
- 182 Main St
- 196 Main St
- 82 South Ave Unit 94
- 82 South Ave
- 84 South Ave Unit 84
- 84 South Ave
- 9 E Maple St
- 11 E Maple St Unit 11
- 9 E Maple St Unit 9
- 11 E Maple St
- 92 South Ave
- 90 South Ave
- 92 South Ave Unit V/S