Estimated Value: $251,000 - $323,279
3
Beds
2
Baths
1,843
Sq Ft
$164/Sq Ft
Est. Value
About This Home
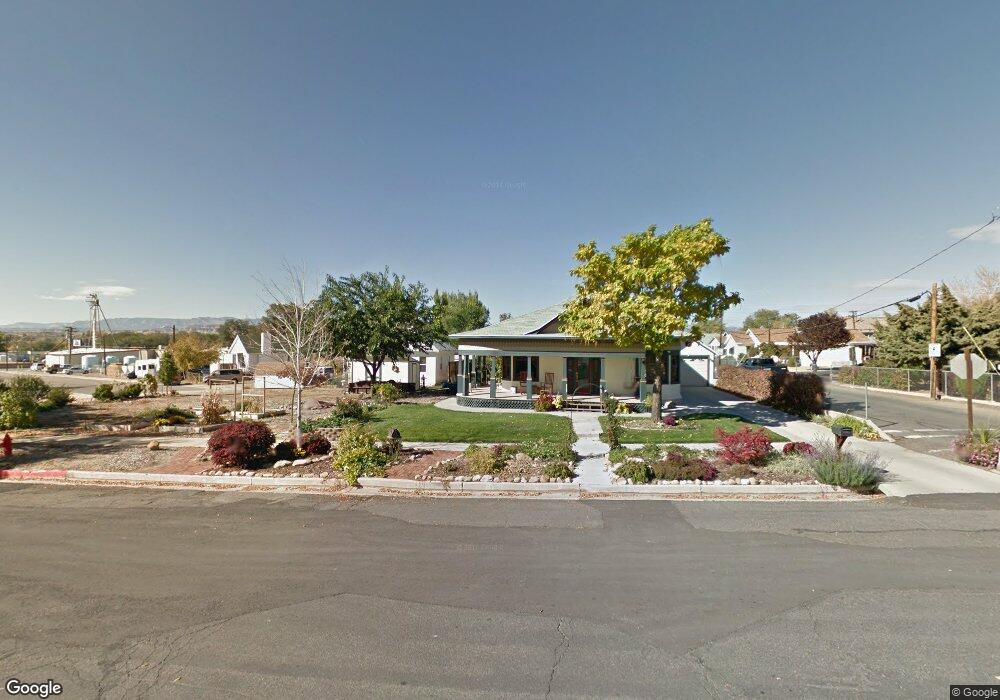
This home is located at 191 N 100 W, Price, UT 84501 and is currently estimated at $302,070, approximately $163 per square foot. 191 N 100 W is a home located in Carbon County with nearby schools including Castle Heights School, Mont Harmon Junior High School, and Carbon High School.
Ownership History
Date
Name
Owned For
Owner Type
Purchase Details
Closed on
Sep 30, 2024
Sold by
Niederhauser Michael J and Niederhauser Catherine A
Bought by
Niederhauser Family Trust and Niederhauser
Current Estimated Value
Home Financials for this Owner
Home Financials are based on the most recent Mortgage that was taken out on this home.
Original Mortgage
$50,000
Outstanding Balance
$48,624
Interest Rate
6.46%
Mortgage Type
Credit Line Revolving
Estimated Equity
$253,446
Purchase Details
Closed on
Oct 13, 2022
Sold by
Niederhauser Michael and Niederhauser Catherine
Bought by
Niederhauser Family Trust and Niederhauser
Purchase Details
Closed on
Sep 4, 2018
Sold by
Timothy Randy J and Timothy Jerri L
Bought by
Haldeman John and Bohman Sheila
Purchase Details
Closed on
Nov 15, 2012
Sold by
Mcevoy Grady A and Mcevoy Jeanne M
Bought by
Timothy Randy J and Timothy Jerri L
Create a Home Valuation Report for This Property
The Home Valuation Report is an in-depth analysis detailing your home's value as well as a comparison with similar homes in the area
Home Values in the Area
Average Home Value in this Area
Purchase History
| Date | Buyer | Sale Price | Title Company |
|---|---|---|---|
| Niederhauser Family Trust | -- | Professional Title Services | |
| Niederhauser Michael J | -- | Professional Title Services | |
| Niederhauser Family Trust | -- | Richland Title | |
| Haldeman John | -- | South Eastern Utah Title Co | |
| Timothy Randy J | -- | Professional Title Services |
Source: Public Records
Mortgage History
| Date | Status | Borrower | Loan Amount |
|---|---|---|---|
| Open | Niederhauser Michael J | $50,000 |
Source: Public Records
Tax History Compared to Growth
Tax History
| Year | Tax Paid | Tax Assessment Tax Assessment Total Assessment is a certain percentage of the fair market value that is determined by local assessors to be the total taxable value of land and additions on the property. | Land | Improvement |
|---|---|---|---|---|
| 2025 | $795 | $65,425 | $24,229 | $41,196 |
| 2024 | $1,199 | $99,818 | $16,995 | $82,823 |
| 2023 | $1,540 | $136,783 | $11,888 | $124,895 |
| 2022 | $1,610 | $128,262 | $9,884 | $118,378 |
| 2021 | $1,384 | $171,067 | $15,101 | $155,966 |
| 2020 | $1,357 | $84,209 | $0 | $0 |
| 2019 | $1,207 | $78,546 | $0 | $0 |
| 2018 | $1,012 | $67,185 | $0 | $0 |
| 2017 | $1,000 | $67,185 | $0 | $0 |
| 2016 | $902 | $67,185 | $0 | $0 |
| 2015 | $902 | $67,185 | $0 | $0 |
| 2014 | $896 | $67,185 | $0 | $0 |
| 2013 | $1,205 | $89,482 | $0 | $0 |
Source: Public Records
Map
Nearby Homes