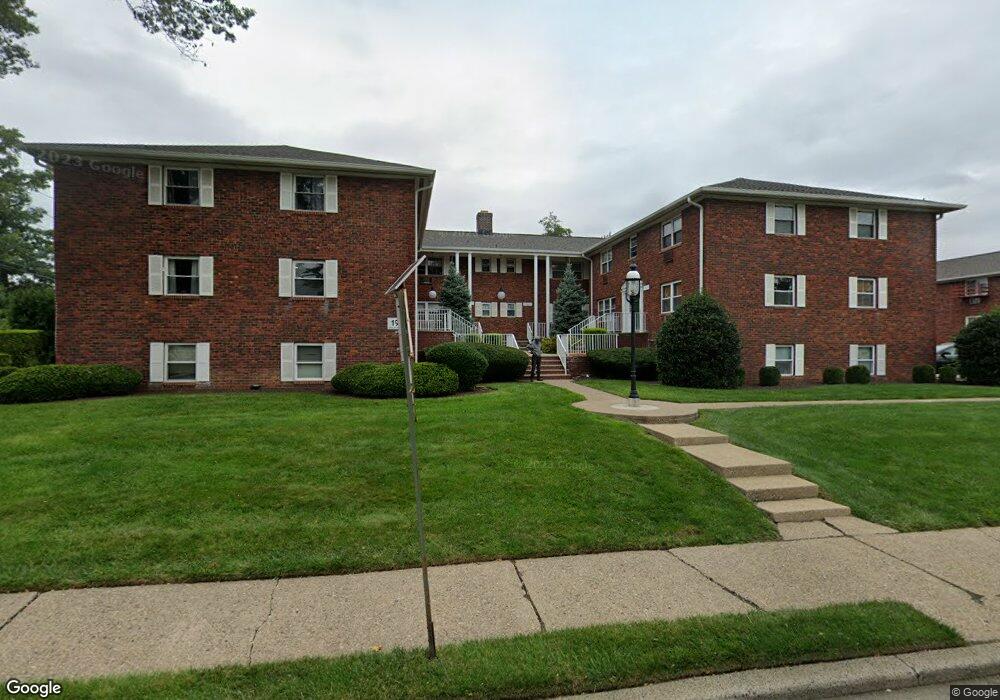
191 N Beverwyck Rd Unit 5 Lake Hiawatha, NJ 07034
Estimated Value: $249,650 - $287,000
1
Bed
1
Bath
722
Sq Ft
$368/Sq Ft
Est. Value
About This Home
This home is located at 191 N Beverwyck Rd Unit 5, Lake Hiawatha, NJ 07034 and is currently estimated at $265,413, approximately $367 per square foot. 191 N Beverwyck Rd Unit 5 is a home located in Morris County with nearby schools including Knollwood School, Central Middle School, and Parsippany High School.
Ownership History
Date
Name
Owned For
Owner Type
Purchase Details
Closed on
Jul 30, 2018
Sold by
Battaglia Maria
Bought by
Battaglia Carlo
Current Estimated Value
Home Financials for this Owner
Home Financials are based on the most recent Mortgage that was taken out on this home.
Interest Rate
4.54%
Purchase Details
Closed on
Oct 31, 2016
Sold by
Kennedy Blvd Corp
Bought by
Battaglia Carolo and Battaglia Maria
Home Financials for this Owner
Home Financials are based on the most recent Mortgage that was taken out on this home.
Original Mortgage
$116,000
Interest Rate
3.94%
Mortgage Type
New Conventional
Purchase Details
Closed on
May 22, 2016
Sold by
Pandolfi Steven and Manor Ii Condominium Associati
Bought by
Citimortgage Inc
Purchase Details
Closed on
Aug 7, 2001
Sold by
Digiorgio Albert
Bought by
Pandolfi Stephen
Home Financials for this Owner
Home Financials are based on the most recent Mortgage that was taken out on this home.
Original Mortgage
$53,940
Interest Rate
7.05%
Create a Home Valuation Report for This Property
The Home Valuation Report is an in-depth analysis detailing your home's value as well as a comparison with similar homes in the area
Home Values in the Area
Average Home Value in this Area
Purchase History
| Date | Buyer | Sale Price | Title Company |
|---|---|---|---|
| Battaglia Carlo | -- | -- | |
| Battaglia Carolo | $14,500,000 | Simplicity Title Llc | |
| Citimortgage Inc | $78,276 | None Available | |
| Windsor Properties Llc | $86,200 | None Available | |
| Pandolfi Stephen | $89,900 | -- |
Source: Public Records
Mortgage History
| Date | Status | Borrower | Loan Amount |
|---|---|---|---|
| Closed | Battaglia Carlo | -- | |
| Previous Owner | Battaglia Carolo | $116,000 | |
| Previous Owner | Pandolfi Stephen | $53,940 |
Source: Public Records
Tax History Compared to Growth
Tax History
| Year | Tax Paid | Tax Assessment Tax Assessment Total Assessment is a certain percentage of the fair market value that is determined by local assessors to be the total taxable value of land and additions on the property. | Land | Improvement |
|---|---|---|---|---|
| 2025 | $3,316 | $96,200 | $37,000 | $59,200 |
| 2024 | $3,253 | $96,200 | $37,000 | $59,200 |
| 2023 | $3,253 | $96,200 | $37,000 | $59,200 |
| 2022 | $2,957 | $96,200 | $37,000 | $59,200 |
| 2021 | $2,957 | $96,200 | $37,000 | $59,200 |
| 2020 | $2,979 | $96,200 | $37,000 | $59,200 |
| 2019 | $2,899 | $96,200 | $37,000 | $59,200 |
| 2018 | $2,836 | $96,200 | $37,000 | $59,200 |
| 2017 | $2,791 | $96,200 | $37,000 | $59,200 |
| 2016 | $2,723 | $96,200 | $37,000 | $59,200 |
| 2015 | $2,656 | $96,200 | $37,000 | $59,200 |
| 2014 | $2,620 | $96,200 | $37,000 | $59,200 |
Source: Public Records
Map
Nearby Homes
- 191 N Beverwyck Rd Unit 1
- 203 N Beverwyck Rd Unit 1
- 203 1 N Beverwyck Rd Unit 1
- 14 Katherine Dr
- 104 N Beverwyck Rd Unit 7
- 74 Longview Ave
- 61 Minnehaha Blvd
- 31.5 Roosevelt Ave
- 30 Madison Ave
- 17 Madison Ave
- 122 Lake Shore Dr
- 21 Nokomis Ave
- 6 Hancock Ct
- 951 N Beverwyck Rd
- 12 Cherokee Ave
- 4 New Hampshire Ct
- 8 New England Dr
- 2 Colony Ct
- 490 Knoll Rd
- 255 Knoll Rd
- 191 N Beverwyck Rd Unit 20
- 191 N Beverwyck Rd Unit 13
- 191 N Beverwyck Rd Unit 9
- 191 N Beverwyck Rd Unit 3
- 191 N Beverwyck Rd Unit 8
- 191 N Beverwyck Rd Unit 17
- 191 N Beverwyck Rd Unit 4
- 191 N Beverwyck Rd Unit 18
- 191 N Beverwyck Rd Unit 12
- 191 N Beverwyck Rd Unit 19
- 191 N Beverwyck Rd Unit 10
- 191 N Beverwyck Rd Unit 11
- 191 N Beverwyck Rd Unit 16
- 191 N Beverwyck Rd Unit 14
- 191 N Beverwyck Rd Unit 7
- 191 N Beverwyck Rd Unit 6
- 191 N Beverwyck Rd Unit 2
- 191 N Beverwyck Rd
- 191 N Beverwyck Rd Unit 2 Unit 2
- 191 N Beverwyck Rd Unit 5 Unit 5