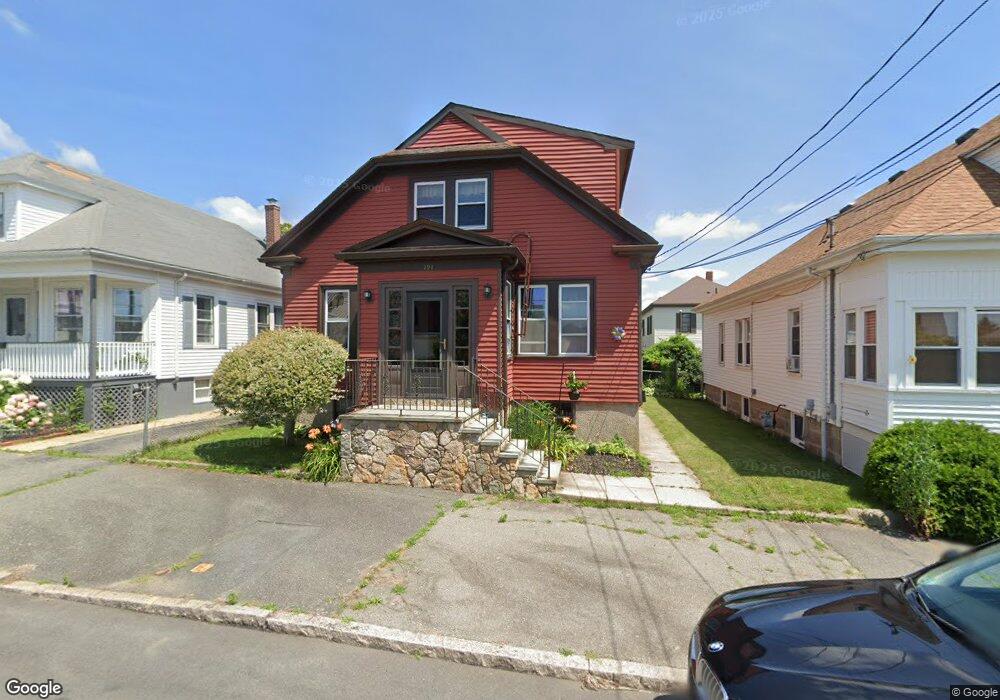
191 Osborne St New Bedford, MA 02740
The South End NeighborhoodEstimated Value: $348,000 - $526,000
4
Beds
2
Baths
2,115
Sq Ft
$209/Sq Ft
Est. Value
About This Home
This home is located at 191 Osborne St, New Bedford, MA 02740 and is currently estimated at $441,744, approximately $208 per square foot. 191 Osborne St is a home located in Bristol County with nearby schools including John B. DeValles Elementary School, Roosevelt Middle School, and New Bedford High School.
Ownership History
Date
Name
Owned For
Owner Type
Purchase Details
Closed on
Apr 9, 2020
Sold by
Demelo Edward
Bought by
Demelo Edward F and Hamilton Shelby L
Current Estimated Value
Purchase Details
Closed on
Feb 1, 2008
Sold by
Us Bk
Bought by
Demelo Edward
Create a Home Valuation Report for This Property
The Home Valuation Report is an in-depth analysis detailing your home's value as well as a comparison with similar homes in the area
Home Values in the Area
Average Home Value in this Area
Purchase History
| Date | Buyer | Sale Price | Title Company |
|---|---|---|---|
| Demelo Edward F | -- | None Available | |
| Demelo Edward F | -- | None Available | |
| Demelo Edward | $173,250 | -- | |
| Us Bk | $230,000 | -- | |
| Demelo Edward | $173,250 | -- |
Source: Public Records
Mortgage History
| Date | Status | Borrower | Loan Amount |
|---|---|---|---|
| Previous Owner | Demelo Edward | $140,000 |
Source: Public Records
Tax History Compared to Growth
Tax History
| Year | Tax Paid | Tax Assessment Tax Assessment Total Assessment is a certain percentage of the fair market value that is determined by local assessors to be the total taxable value of land and additions on the property. | Land | Improvement |
|---|---|---|---|---|
| 2025 | $4,259 | $376,600 | $89,800 | $286,800 |
| 2024 | $3,749 | $312,400 | $86,600 | $225,800 |
| 2023 | $3,444 | $241,000 | $72,500 | $168,500 |
| 2022 | $3,125 | $201,100 | $70,600 | $130,500 |
| 2021 | $1,931 | $197,900 | $67,400 | $130,500 |
| 2020 | $3,096 | $191,600 | $67,400 | $124,200 |
| 2019 | $3,037 | $184,400 | $67,400 | $117,000 |
| 2018 | $5,582 | $174,600 | $67,400 | $107,200 |
| 2017 | $4,866 | $161,100 | $69,000 | $92,100 |
| 2016 | $2,594 | $157,300 | $69,000 | $88,300 |
| 2015 | $2,422 | $154,000 | $69,000 | $85,000 |
| 2014 | $2,342 | $154,500 | $69,000 | $85,500 |
Source: Public Records
Map
Nearby Homes
- 195 Osborne St
- 187 Osborne St
- 188 Frank St
- 194 Frank St
- 179 Osborne St
- 188 Osborne St
- 180 Frank St
- 310 Hemlock St
- 314 Hemlock St
- 314 Hemlock St Unit 2
- 198 Osborne St Unit 200
- 180 Osborne St
- 316 Hemlock St Unit 318
- 171 Osborne St
- 171 Osborne St Unit Floor 1
- 176 Frank St
- 197 Norwell St
- 320 Hemlock St Unit 322
- 185 Norwell St
- 193 Frank St