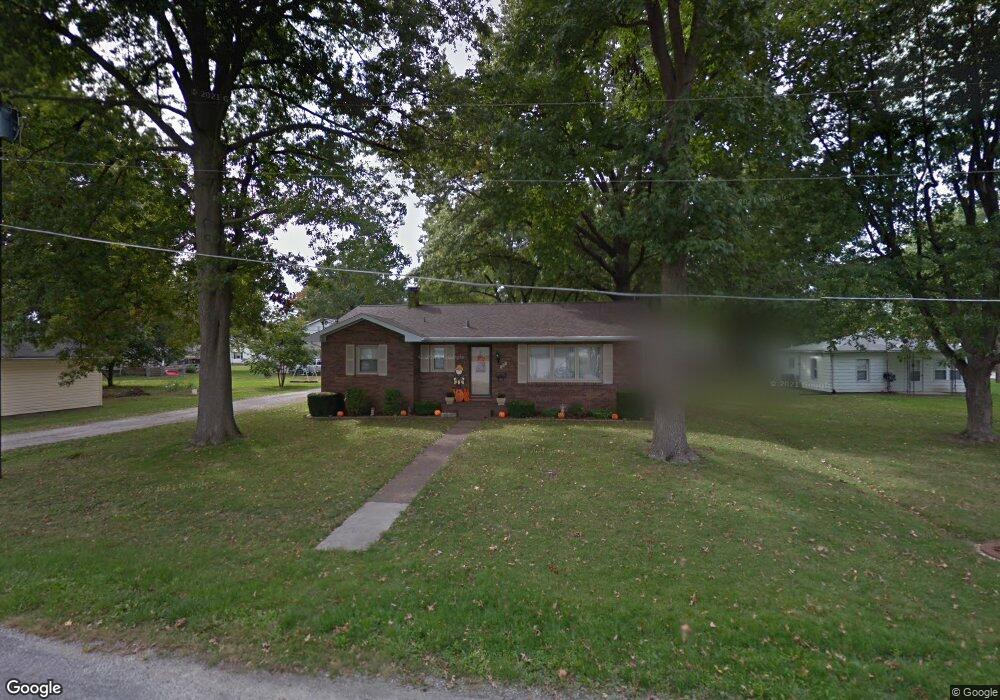
191 S Chestnut St Breese, IL 62230
Estimated Value: $160,000 - $224,000
Studio
1
Bath
1,187
Sq Ft
$158/Sq Ft
Est. Value
About This Home
This home is located at 191 S Chestnut St, Breese, IL 62230 and is currently estimated at $187,657, approximately $158 per square foot. 191 S Chestnut St is a home located in Clinton County with nearby schools including Breese ESD #12, Beckemeyer Elementary School, and Central Community High School.
Ownership History
Date
Name
Owned For
Owner Type
Purchase Details
Closed on
Jan 18, 2019
Sold by
Gerstner Gary L
Bought by
Gerstner Logan E
Current Estimated Value
Home Financials for this Owner
Home Financials are based on the most recent Mortgage that was taken out on this home.
Original Mortgage
$105,000
Outstanding Balance
$92,316
Interest Rate
4.6%
Mortgage Type
New Conventional
Estimated Equity
$95,341
Purchase Details
Closed on
Dec 5, 2014
Sold by
Gerstner Jacqueline May and Gerstner Charles Francis
Bought by
Gerstner Gary L
Create a Home Valuation Report for This Property
The Home Valuation Report is an in-depth analysis detailing your home's value as well as a comparison with similar homes in the area
Home Values in the Area
Average Home Value in this Area
Purchase History
| Date | Buyer | Sale Price | Title Company |
|---|---|---|---|
| Gerstner Logan E | $125,000 | None Available | |
| Gerstner Gary L | $50,000 | Highland Community Title Llc |
Source: Public Records
Mortgage History
| Date | Status | Borrower | Loan Amount |
|---|---|---|---|
| Open | Gerstner Logan E | $105,000 |
Source: Public Records
Tax History
| Year | Tax Paid | Tax Assessment Tax Assessment Total Assessment is a certain percentage of the fair market value that is determined by local assessors to be the total taxable value of land and additions on the property. | Land | Improvement |
|---|---|---|---|---|
| 2024 | $3,307 | $53,950 | $9,810 | $44,140 |
| 2023 | $3,307 | $50,890 | $9,250 | $41,640 |
| 2022 | $3,265 | $46,260 | $8,410 | $37,850 |
| 2021 | $2,916 | $44,060 | $8,010 | $36,050 |
| 2020 | $2,848 | $42,360 | $7,700 | $34,660 |
| 2019 | $2,794 | $42,360 | $7,700 | $34,660 |
| 2018 | $2,502 | $36,775 | $7,530 | $29,245 |
| 2017 | $2,428 | $35,360 | $7,240 | $28,120 |
| 2016 | $2,404 | $35,360 | $7,240 | $28,120 |
| 2015 | $1,968 | $35,360 | $7,240 | $28,120 |
| 2013 | $1,968 | $37,940 | $7,240 | $30,700 |
Source: Public Records
Map
Nearby Homes
Your Personal Tour Guide
Ask me questions while you tour the home.